I didn't make any specific projection for the end of June as I've been swamped with my COVID vaccination tracking project, though I generally expected the enrollment pace to drop off significantly (anyone enrolling in June didn't have their policy kick in until July 1st, meaning their deductible & out-of-pocket cap would be the same even though they're only getting 6 months to use them up). Several hundred thousand more was a reasonable assumption, which would probably bring the national total up to somewhere in the 2 million range.
For the updated graph below, I've made a few more tweaks to both my data sources and the graph itself, neither of which makes that much of a difference in terms of impact on the final results:
Colorado's Health Insurance Marketplace Maintains Enrollment Momentum
There's still time to enroll
DENVER – As of Wednesday, July 7, 205,813 Coloradans have signed up for a plan that provides coverage this year through Connect for Health Colorado. That’s an additional 5,000 enrollments since last month when Connect for Health Colorado announced its Marketplace had reached a historic enrollment milestone for the 2021 plan year.
That's actually 5,694 more enrollees since June 7th, although they may be knocking it down a bit to account for attrition/etc. That amounts to 190 additional enrollees per day, which is actually up from the ~167/day which Colorado had been averaging from May through June. Huh.
Surprise bills happen when an out-of-network provider is unexpectedly involved in a patient’s care. Patients go to a hospital that accepts their insurance, for example, but get treated there by an emergency room physician who doesn’t. Such doctors often bill those patients for large fees, far higher than what health plans typically pay.
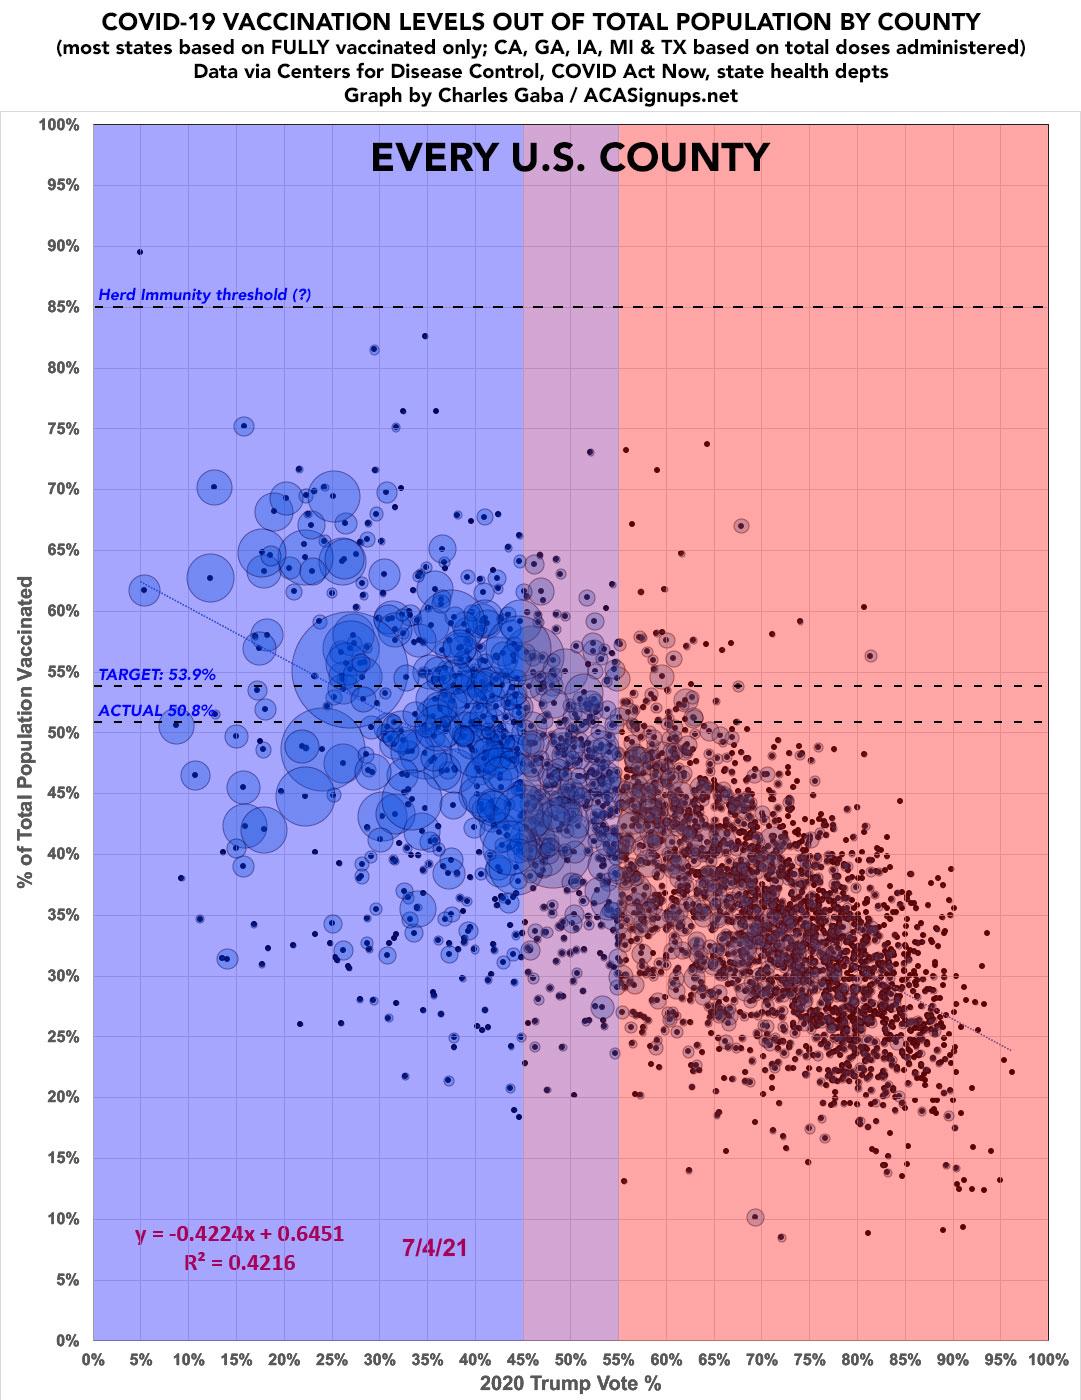
As I've been noting for months (and as the mainstream press has finally started picking up on), while there are several factors explaining why so many people haven't gotten vaccinated yet, the single biggest determining factor is their political lean and, even more specifically, who they voted for President last fall.
However, the impact of partisan lean varies widely from state to state. In some states the regression line is a steep partisan slope, in others the slope is barely there at all. In some states the R-squared (R^2) figure, which helps determine correlation of the partisan lean variable, is high (above 0.7) while in others it's below 0.1.
As I've been noting for months (and as the mainstream press has finally started picking up on), while there are several factors explaining why so many people haven't gotten vaccinated yet, the single biggest determining factor is their political lean and, even more specifically, who they voted for President last fall.
However, there are some outliers, as you would expect when you're looking at a nation of over 330 million people.
According to the latest data, if you take the original "every county" graph...
It's been over a month since I last ran a scatter plot displaying current COVID-19 vaccination rates across every COUNTY nationwide according to the 2020 election results...all 3,100+ of them. With today being the 4th of July, which also happens to be the target date for President Biden's call for at least 70% of all U.S. adults to have received their first vaccination shot.
Missouri just voted #YesOn2 to expand Medicaid, and now, because of YOUR vote, over 230,000 hardworking people will have access to life-saving healthcare!pic.twitter.com/azHN0GJjEW
— YesOn2: Healthcare for Missouri (@YesOn2MO) August 5, 2020
Republican lawmakers blocked Medicaid expansion funding from reaching the Missouri House floor on Wednesday, posing a setback for the voter-approved plan to increase eligibility for the state health care program.
As my regular readers know, a few weeks ago I dove head first into a 2-week project to graph out the COVID-19 vaccination levels per capita across all 3,100+ counties to see where things stood in all 50 states.
Given how insanely politicized the COVID pandemic has been due to the Trump Administration deliberately doing so right from the outset, I ran scatter plot graphs based on what percent of the popular vote was received in each county by Trump last November for every state.
Sure enough, I found a strong inverse correlation between the two in most states, and a weaker (but still significant) correlation in many others. Correlation does not equal causation, of course, and there are plenty of other factors involved in how rapidly a population gets vaccinated, but there's no denying that partisanship is pretty clearly a significant one.
For the past couple of weeks, I've been on a marathon session of analyzing and graphing out total enrollment in Medicaid in every state for each month from 2014 until now (using estimates based on the best available data for the first part of 2021).
Now that I've completed this for all 50 states +DC, I'm bringing it all together into a single national graph showing how enrollment has changed over time.
Aside from the initial ramping up of enrollment after ACA Medicaid expansion went into effect in most states starting in early 2014 (and an odd drop-off/jump in California in the third quarter of 2017), enrollment was pretty steady at the national level...until COVID struck in early 2020.