

UPDATE: REGIONAL U.S. vaccination rates by county
Mon, 07/05/2021 - 2:07pm
Yesterday I posted a completely updated county-level look at where COVID-19 vaccinations stand based on the 2020 Presidential election results.
As I've been noting for months (and as the mainstream press has finally started picking up on), while there are several factors explaining why so many people haven't gotten vaccinated yet, the single biggest determining factor is their political lean and, even more specifically, who they voted for President last fall.
However, the impact of partisan lean varies widely from state to state. In some states the regression line is a steep partisan slope, in others the slope is barely there at all. In some states the R-squared (R^2) figure, which helps determine correlation of the partisan lean variable, is high (above 0.7) while in others it's below 0.1.
I've therefore broken out all 3,100+ U.S. counties in the 50 states (+DC) into 7 different geographic regions to see if that lends any further insight. I debated on whether to include a few states in one region vs. another. For instance: geographically, Virginia "should" be part of the South while West Virginia "should" be part of the Mid-Atlantic, but politically their statuses have clearly changed over the years. Similarly, Tennessee isn't "officially" included as part of the "Deep South" according to Wikipedia, but it feels like it should be to me.
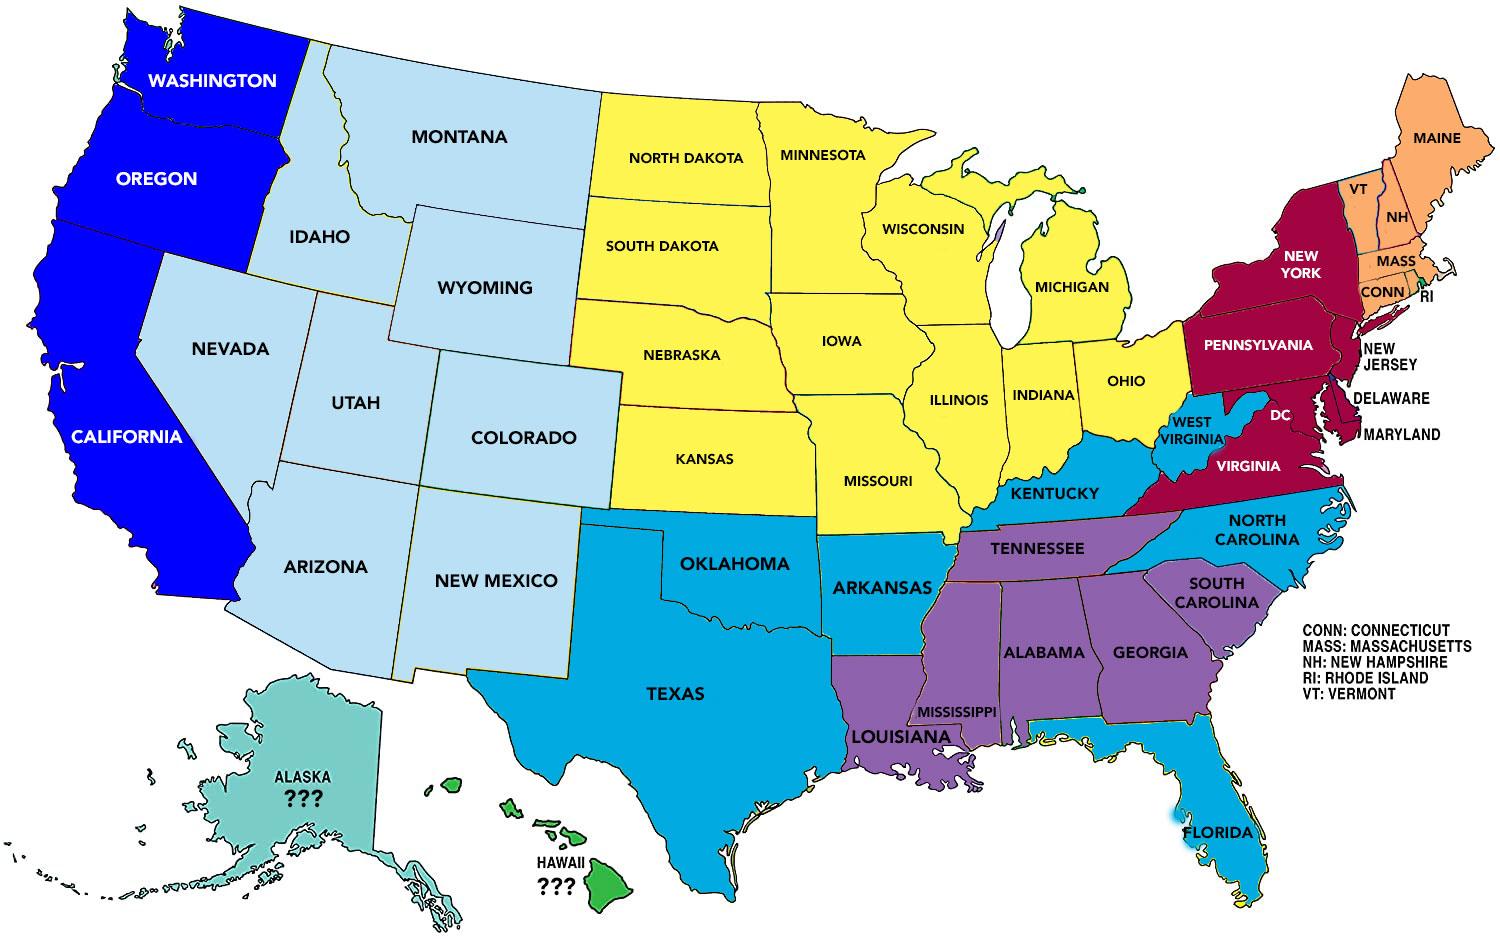
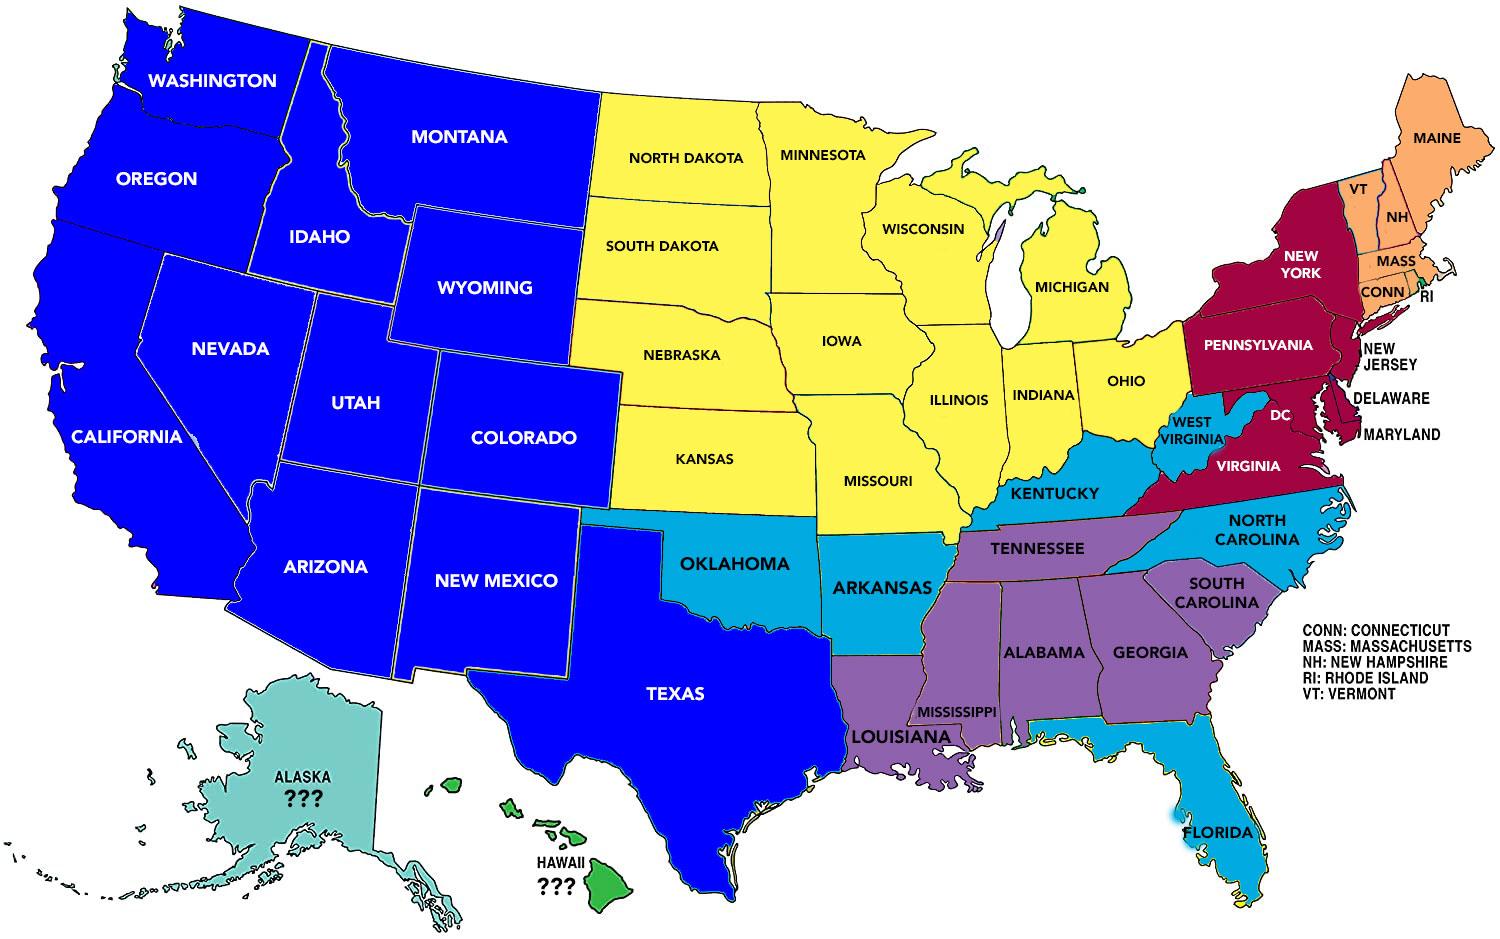
Obviously, your opinion my vary on some of these, but overall I think it's pretty good. Here's a crude map of how I have the country broken out. Note that I didn't know what the heck to do with Alaska and Hawaii, and I seriously debated about whether to split the Dakotas, Nebraska and Kansas out on their own before deciding to keep them lumped in with the rest of the Midwest:
DEEP SOUTH: Alabama, Georgia, Louisiana, Mississippi, South Carolina, Tennessee

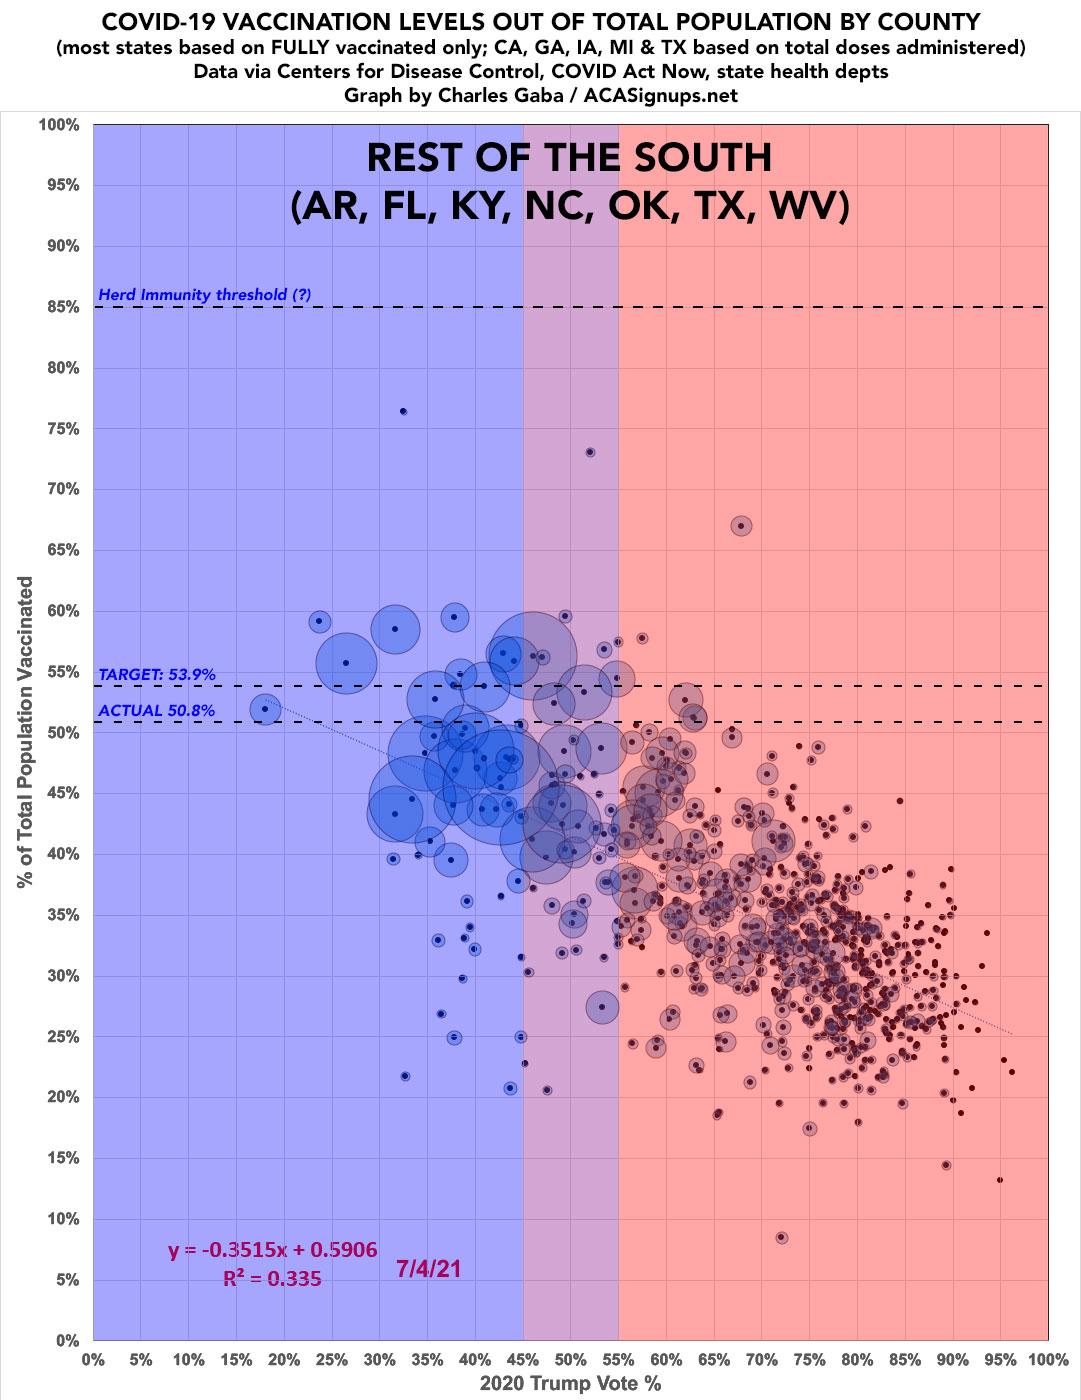
REST OF THE SOUTH: Arkansas, Florida, Kentucky, North Carolina, Oklahoma, Texas, West Virginia
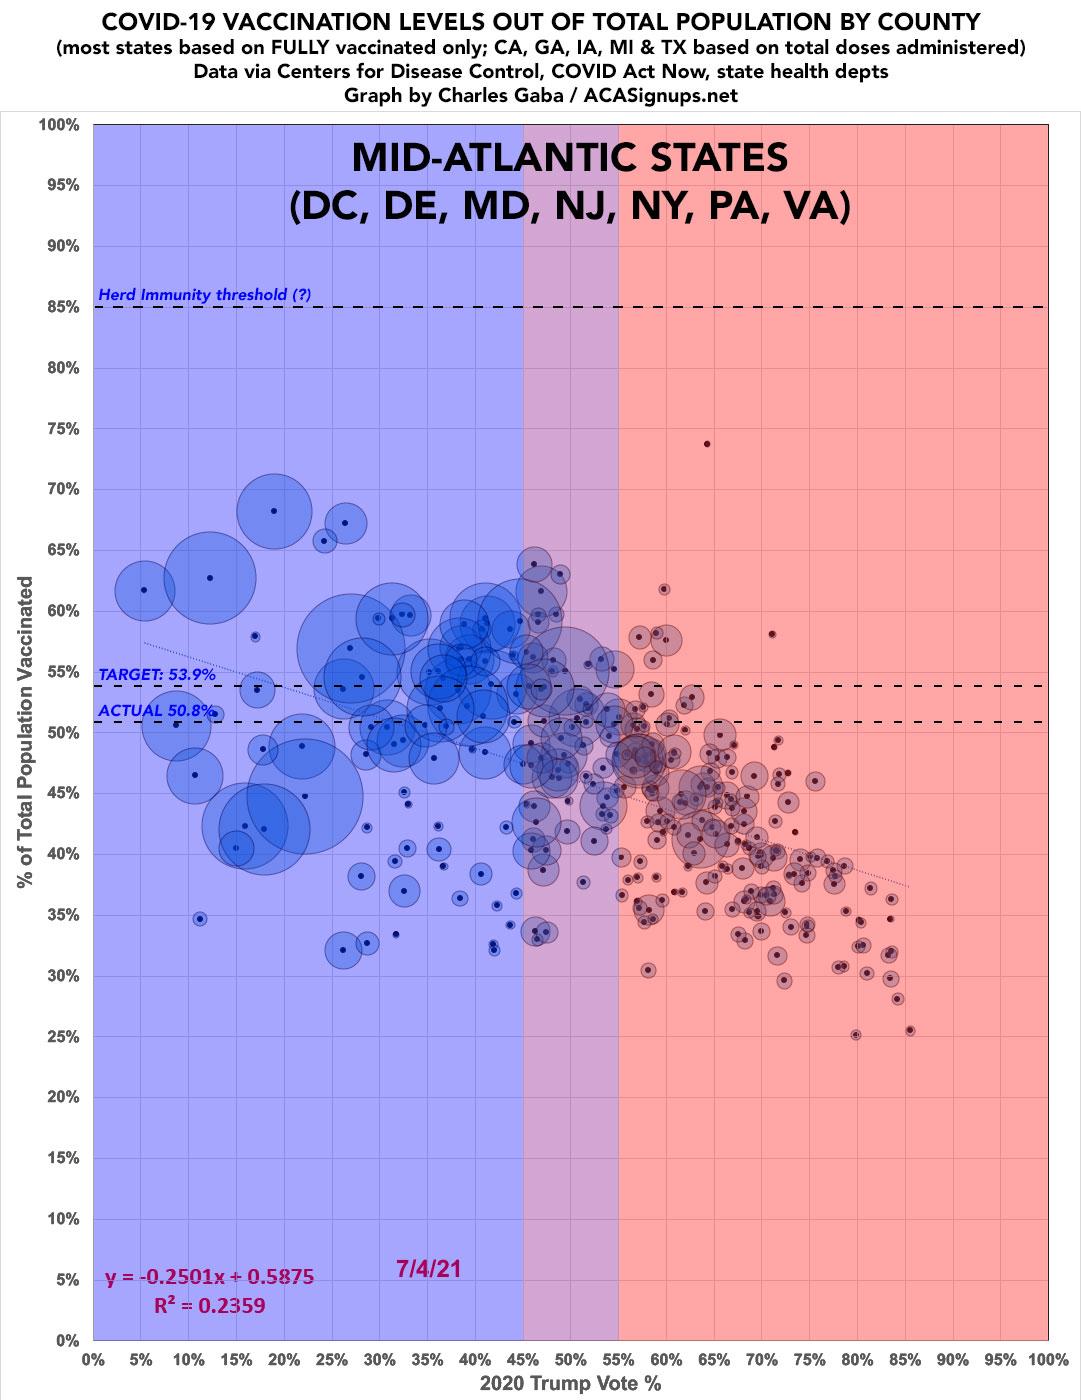
MID-ATLANTIC: Delaware, DC, Maryland, New York, New Jersey, Pennsylvania, Virginia
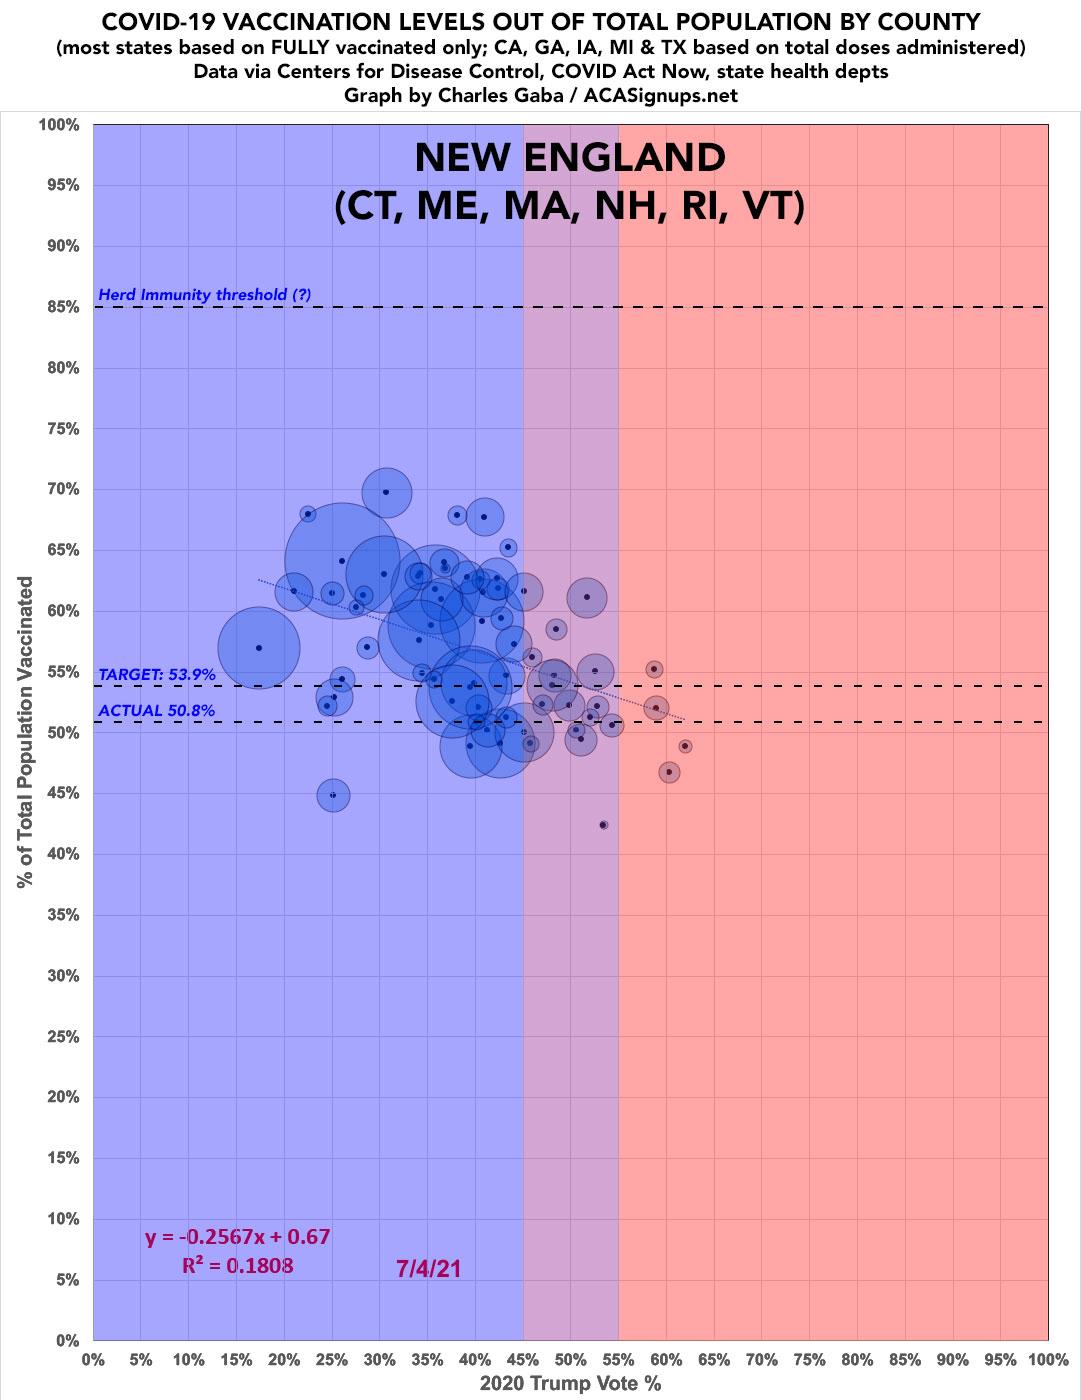
NEW ENGLAND: Connecticut, Maine, Massachusetts, New Hampshire, Rhode Island, Vermont
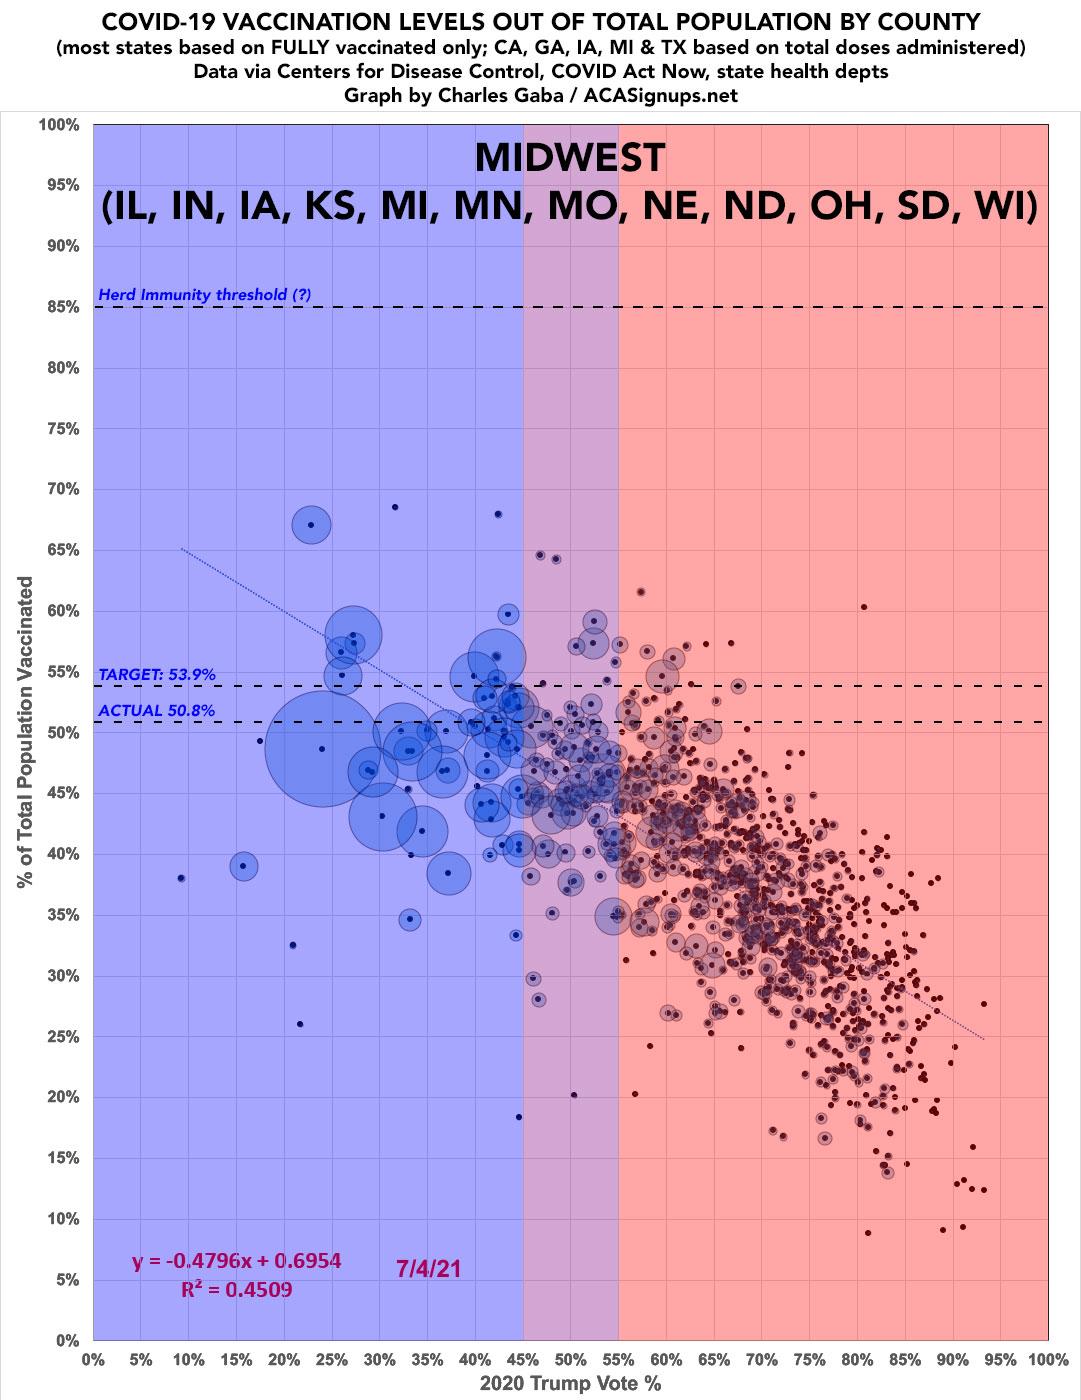
MIDWEST: Illinois, Indiana, Iowa, Kansas*, Michigan, Minnesota, Missouri, Nebraska*, North Dakota*, Ohio, South Dakota*, Wisconsin
*(I debated whether to break KS, NE, ND & SD out into their own 8th Great Plains category but ultimately decided against it.)
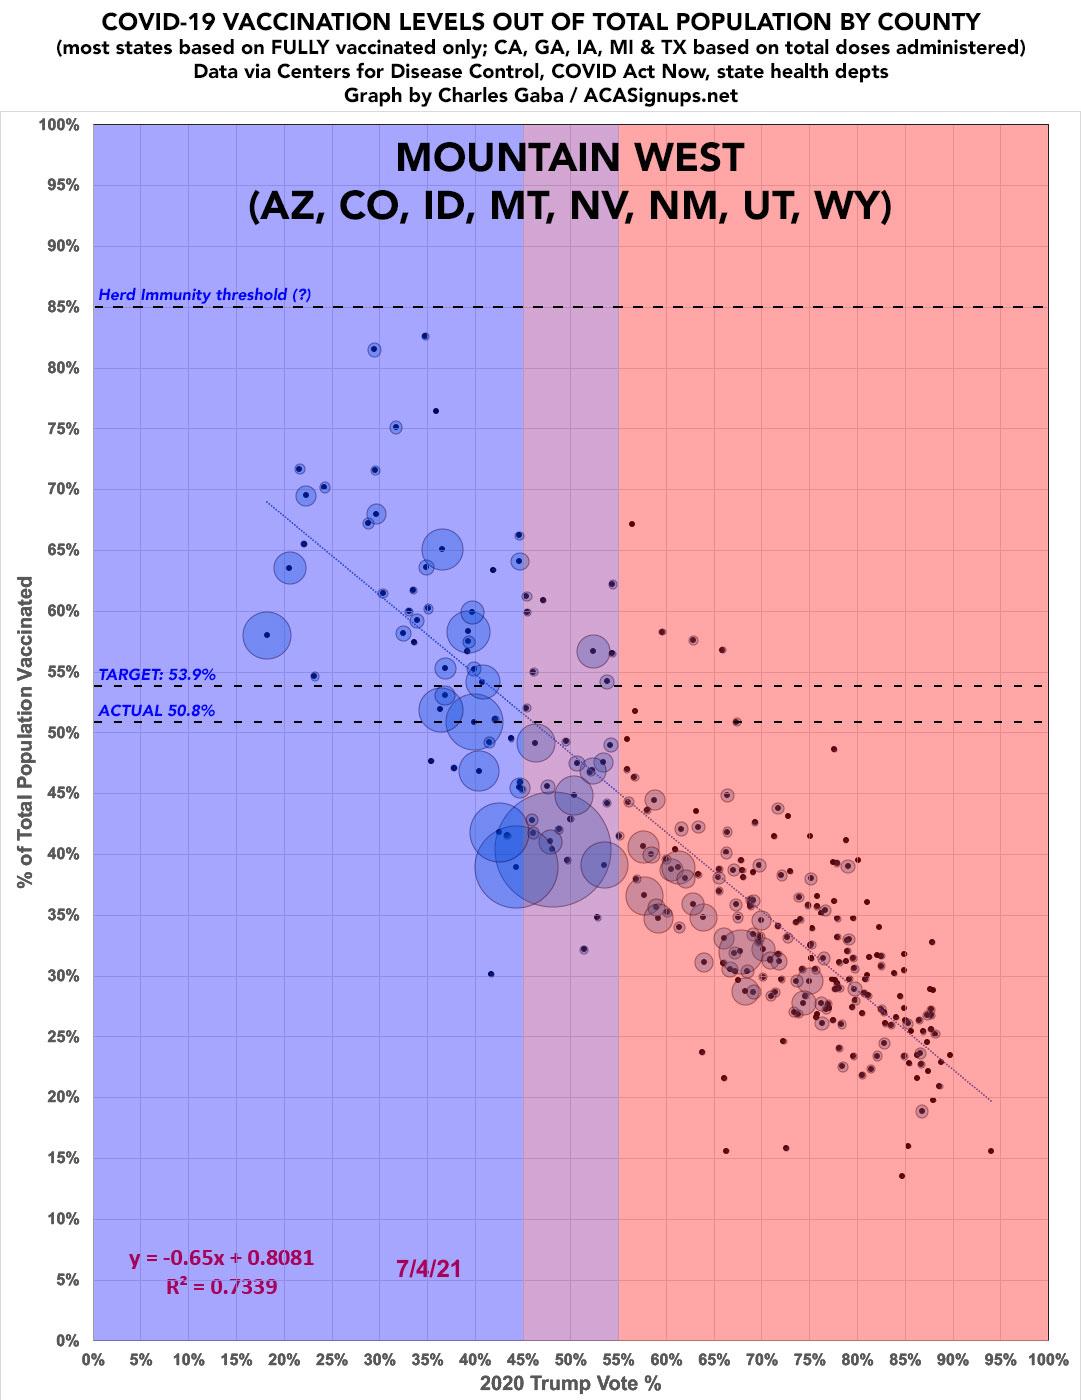
MOUNTAIN WEST: Arizona, Colorado, Idaho, Montana, Nevada, New Mexico, Utah, Wyoming
WEST COAST:** California, Oregon, Washington State
**ALASKA and HAWAII didn't seem to fit into any of the above categories for obvious reasons.
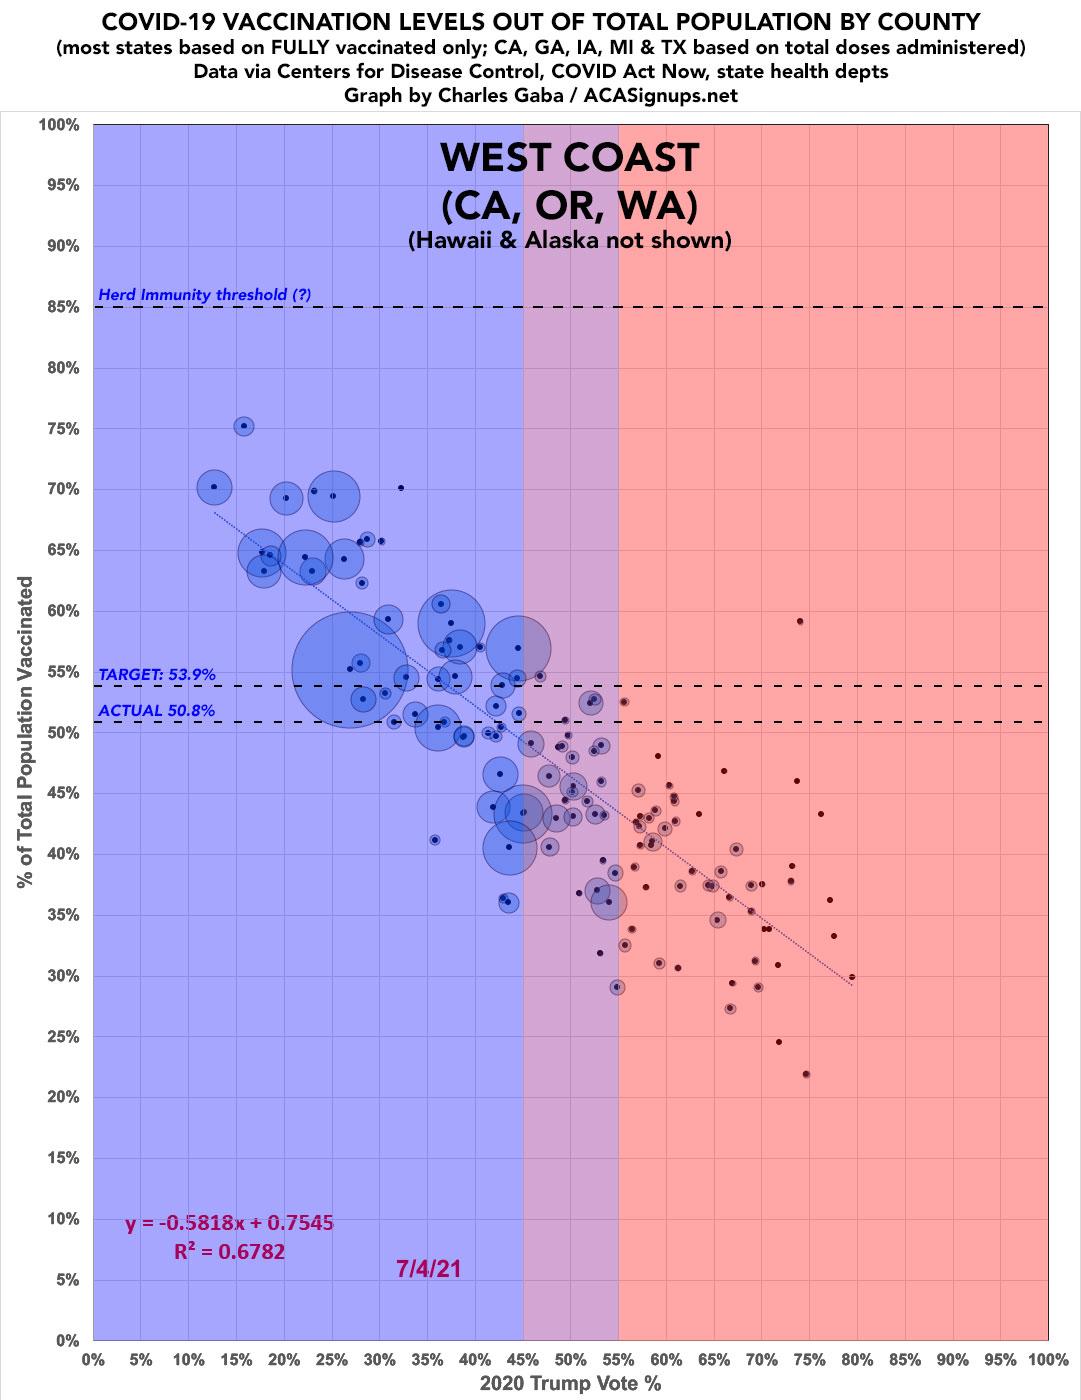
The most obvious takeaway is that the Mountain West and West Coast states have the most dramatic partisan-lean factors in both slope steepness and correlation...while the Deep South states have the smallest correlation and slope.
I've already written about the obvious racial inequity factors which seem to be causing even the bluest Deep South counties to lag so far behind in vaccination rates. I don't have any similar insight into what's going on with the Mountain West/West Coast states, however.
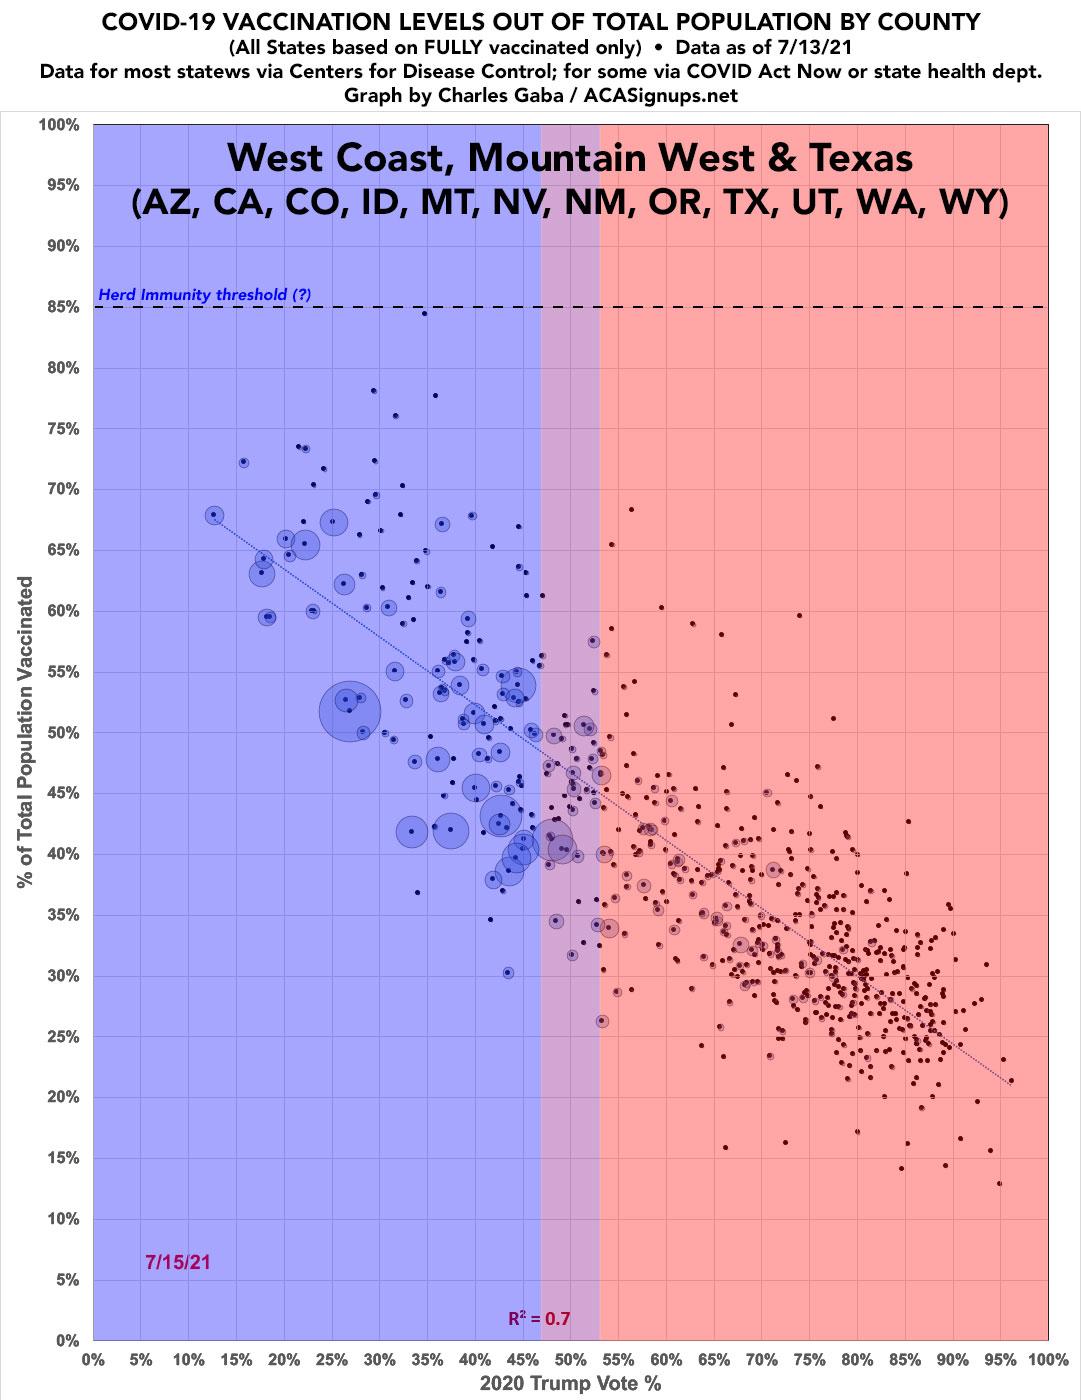
UPDATE 7/15/21: I decided to merge the West Coast and Mountain West states together...and also threw in Texas as well, since it's connected to the rest of them and also has a high R^2 factor (0.6083) with the highest number of counties in the nation (254).
The result is stunning: R^2 for all 12 states combined (which make up nearly 1/3 of the entire U.S. population) is exactly 0.7.
Advertisement
