

Old 'n Busted: Medicaid/CHIP enrollment breaks 80 million. New Hotness: Medicaid/CHIP enrollment breaks 88 million?
Wed, 06/23/2021 - 1:23pm
For the past couple of weeks, I've been on a marathon session of analyzing and graphing out total enrollment in Medicaid in every state for each month from 2014 until now (using estimates based on the best available data for the first part of 2021).
Now that I've completed this for all 50 states +DC, I'm bringing it all together into a single national graph showing how enrollment has changed over time.
Aside from the initial ramping up of enrollment after ACA Medicaid expansion went into effect in most states starting in early 2014 (and an odd drop-off/jump in California in the third quarter of 2017), enrollment was pretty steady at the national level...until COVID struck in early 2020.
Since then, the combination of sudden, massive unemployment combined with the Families First & CARES COVID Relief acts (which boost federal funding of Medicaid programs while also prohibiting states from disenrolling current Medicaid enrollees during the public health crisis) have resulted in overall Medicaid enrollment rising dramatically over the past year and a half.
My colleague Andrew Sprung, who has also been tracking Medicaid enrollment throughout the COVID era, was the first to note that total Medicaid enrollment likely broke the 80 million mark for the first time in U.S. history back in January.
Phil Galewitz of Kaiser Health News then confirmed this a week or so ago...and a few days later, the Centers for Medicare & Medicaid made it official with this press release and the accompanying data report:
The Centers for Medicare & Medicaid Services (CMS) released a new Enrollment Trends Snapshot report today showing a record high, over 80 million individuals have health coverage through Medicaid and the Children’s Health Insurance Program (CHIP). Nearly 9.9 million individuals, a 13.9% increase, enrolled in coverage between February 2020, the month before the public health emergency (PHE) was declared, and January 2021.
Among the 50 states and the District of Columbia, a total of 80,543,351 people were enrolled and receiving full benefits from the Medicaid and CHIP programs by the end of January 2021. In the 50 states that reported total Medicaid child and CHIP enrollment data for January 2021, over 38.3 million children were enrolled in Medicaid and CHIP combined, approximately 50% of the total Medicaid and CHIP enrollment. These numbers highlight the essential role the Medicaid and CHIP programs play in providing quality and needed coverage for millions of vulnerable children and adults. In fact, both programs serve as the largest single source of health coverage in the country.
...The increase in total Medicaid and CHIP enrollment is largely attributed to the impact of the COVID-19 PHE, in particular, enactment of section 6008 of the Families First Coronavirus Response Act (FFCRA). FFCRA provides states with a temporary 6.2% payment increase in Federal Medical Assistance Percentage (FMAP) funding. States qualify for this enhanced funding by adhering to the Maintenance of Effort requirement, which ensures eligible people enrolled in Medicaid stay enrolled and covered during the PHE.
There's some important caveats to keep in mind here.
First, as noted by Sprung, Galewitz and CMS alike, even that "80 million" figure is still only as of January. It's June now, and as both Sprung and I have noted on our blogs, Medicaid enrollment has continued to climb since then (CMS data only runs through January, but we've each been poring over the individual state health dept's Medicaid enrollment reports and extrapolating from there). Sprung, for instance, put the grand total at around 82.6 million as of May...or almost exactly 1/4 of the entire U.S. population.
When I plugged the numbers in through June, however, I get an even higher estimate...one which potentially breaks 90 million.
Obviously it's extremely unlikely that enrollment jumped by a whopping 9% in just one month, so what accounts for the difference in our estimates? Well, it mostly has to do with methodology and which program enrollments you include.
Sprung bases his estimates on the same reports used by Galewitz and CMS itself: The Medicaid & CHIP Enrollment Trends Snapshot...whereas I've been using data collected through the Medicaid Budget and Expenditure System (MBES).
Both systems are run through the Medicaid division of CMS, so what's the difference? Plenty:
State Medicaid expenditure reports are generally submitted to CMS within 30 days following the end of each quarter (e.g., the expenditure report for January 1, 2014 – March 31, 2014 was due April 30, 2014). Some states, however, submit their expenditure reports later. Further, the enrollment data is a new element of the MBES report and states are continuing to adjust their systems to provide the new data elements, which can result in a delay before data is available to be released publicly.
When states submit their Medicaid expenditure reports, they certify the data are accurate and CMS conducts a limited review to assess whether the data is reasonable. The review consists of comparing the state-reported data to other readily available information, including state-reported performance indicators and expenditures, and follow-up with the state as needed. Data collection through the forthcoming T-MSIS system (which will use the same definition as the MBES report) will undergo a more thorough quality review and will serve as the authoritative enrollment data. MBES provides preliminary reporting of this data.
The MBES data may not perfectly align with other sources of enrollment data, including data obtained from states through the Medicaid and CHIP Performance Indicator process. The differences between the MBES data and Performance Indicator data may result from one or a combination of various factors, including but not limited to, the following:
- The MBES data and the Performance Indicator data rely on different definitions of enrollees. Examples of these differences include:
- The MBES count includes individuals enrolled in limited benefit plans and the Performance Indicator count does not include such individuals.
- The MBES data represents the count of unduplicated individuals enrolled in the state’s Medicaid program at any time during each month in the quarterly reporting period, while the Performance Indicator data captures the count of individuals enrolled on the last day of the month.
- The MBES count only includes individuals whose coverage is funded through Medicaid (title XIX of the Social Security Act), while the published Performance Indicator also includes individuals funded through CHIP (title XXI of the SSA).
- MBES and Performance Indicator data may be derived from different state systems.
- Retroactive state adjustments to MBES or Performance Indicator data may be in progress.
- States have likely generated MBES data and Performance Indicator data from state systems on different dates.
Once reviewed, the enrollment information for each state will be posted to this page. States have the opportunity to update their enrollment data with each quarterly expenditure report submission for up to a year. When a new quarter of enrollment data is posted, the enrollment data for the previous three quarters will also be updated. As we progress through the first year of this new enrollment reporting, we are continuing to work with states to promote timely and accurate information.
Some of the bullets above probably cancel each other out, such as the "different state systems" or the retroactive adjustments. Others, however, either increase or decrease the totals for one or the other dramatically. Two of them boost the MBES total...
- it includes those on limited benefit Medicaid plans as well.
- it includes enrollees who dropped out of the program earlier in the month instead of only those still enrolled on the last day of the month.
...but the third dramatically boosts the Performance Indicator total:
- it includes children enrolled in the Children's Health Insurance Program as well (CHIP) as well.
How much of a difference does that make? Well, according to the January 2021 Performance Indicator report, nearly 6.8 million children were enrolled in CHIP on the last day of January....meaning only 73.7 million Americans were enrolled in the "official" Medicaid program on that date, versus the 80.5 million combined total. If you don't include CHIP (and I'm not saying you shouldn't!), the total drops by about 8.4%.
On the flip side, the official federal government CHIP website touts the fact that 9.68 million were enrolled in CHIP "at any time" in 2019...even though the Performance Indicator reports show that only between 6.5 - 6.6 million were enrolled in any specific month during 2019. In other words, the total number of children enrolled at any point in 2019 is 47% higher than the number enrolled at any given point.
The same clearly holds true to some extent at the month/day level: The number of people enrolled at any point throughout a given month will be a bit higher than the number enrolled on the last day of that month, though probably not to such a dramatic level. That explains some of the higher MBES number, along with including those in "limited benefit" plans.
In addition, there's yet another factor not listed above: The U.S. Territories. The MBES reports include the District of Columbia, Puerto Rico, American Samoa, Guam, the Northern Mariana Islands and the U.S. Virgin Islands...but for whatever reason, CMS's Performance Indicator reports only include DC.
I don't know if this is because all Medicaid programs in PR, AS, GU, NMI and USVI are considered "partial" or if it's due to some other legal/jurisdictional reason, but as of December 2020, the MBES reports say there were 1.47 million people enrolled in Medicaid in those five U.S. territories.
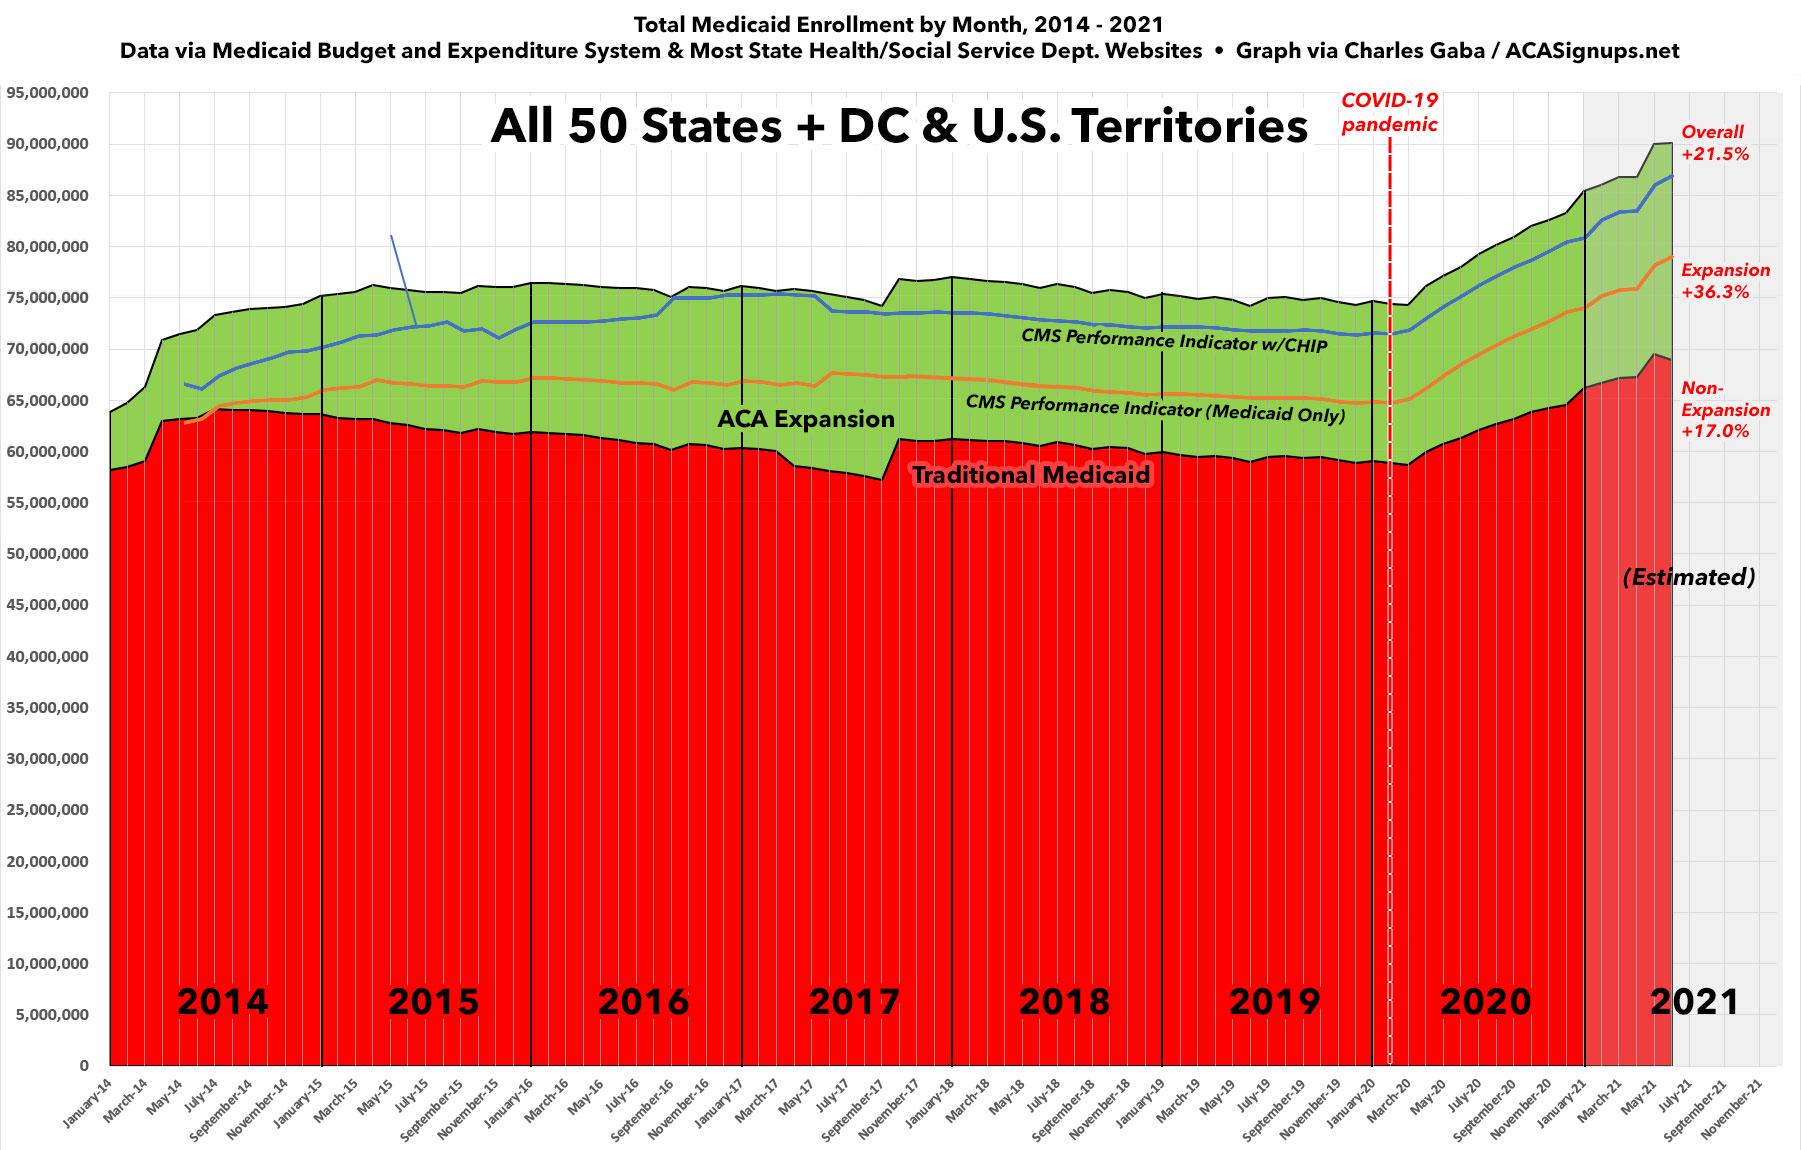
With all of the above in mind, the graph below shows both methodologies over time, using official data through January 2021 (Performance Indicator lines) or December 2020 (MBES lines), and my best estimates based on partial state-level data for each from Jan/Feb until now.
My conclusion: Total Medicaid + CHIP enrollment nationally as of June 2021 is somewhere betwee 86.5 million (using Performance Indicator methodology) and 90.5 million (using MBES methodology).
Hell, if you were to use the MBES data and add "at any point" CHIP enrollment on top of that as well, it would theoretically break 100 million, but that's probably stretching things a bit too much.
If you want to only count the "end of month" numbers for those receiving full Medicaid services, I think a more accurate total would be to take the Peformance Indicator total (Medicaid + CHIP combined), then add only the U.S. territories. By my reckoning, this should be roughly 86.5 million + 1.5 million, for a grand total of around 88.0 million Americans enrolled in full-service Medicaid+CHIP as of June 2021.
Advertisement
