IMPORTANT:Premium Alignment is NOT a substitute for making the enhanced ACA tax credits permanent. It does little to help the lowest-income folks who are still better off with Silver plans thanks to robust CSR assistance, and the benefits of it will be mediocre for those over 400% FPL if the enhanced tax credits expire.
Even for those it benefits the most (primarily those who earn between 200 - 400% FPL), it's a complement to the upgraded subsidies, not a replacement for them.
HOWEVER, it's still hugely helpful to those who know how to take advantage of it, and particularly in the states newly implementing it, it should relieve a huge portion of the pain being caused by the enhanced APTC expiring next month.
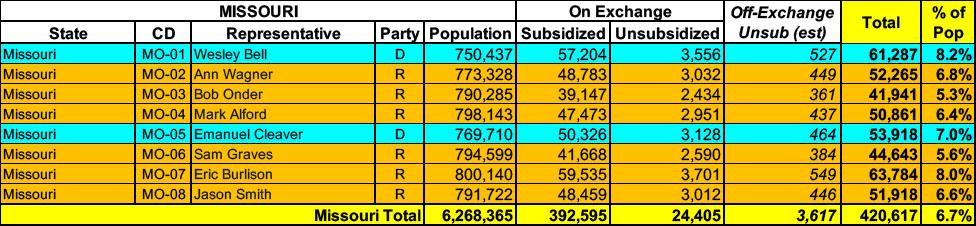
Missouri has around ~417,000 residents enrolled in ACA exchange plans, 94% of whom are currently subsidized. I estimate they also have another ~3,600 unsubsidized off-exchange enrollees.
Healthy Alliance Life Insurance Company (HALIC) has filed for premium rate changes for its Affordable Care Act (ACA) compliant Individual health insurance plans. This filing includes an average rate change of 21.23%, effective January 1, 2026, with plan prices changing between 18.75% and 24.73%. The price changes will impact about 52,000 people that have HALIC plans now and will keep HALIC plans next year. An insured person’s actual rate increase could be higher or lower depending on their benefit, where they live, how old they are, number of children, and if they use tobacco.
Every year, even when the ACA is running smoothly, there are always changes in market participation, as different insurance carriers enter or exit the individual market in certain states or either expand or shrink what parts of the state they offer healthcare policies in.
2026 is no exception, and given the massive turmoil the ACA exchanges are undergoing right now (due primarily to the expiring federal tax credits as well as regulatory changes made by the Trump Regime's so-called "Integrity & Affordability Rule"), there's either 13 or 32 insurance carriers throwing in the towel in one or more states, depending on how you count a carrier operating in multiple states or under multiple subsidiary brandings.
It's important to keep in mind that the following list probably isn't comprehensive--it includes the carriers which I've confirmed are pulling out statewide (with one exception: Meridian Health Plan of Michigan is only pulling out of parts of the state). There's likely one or two that I've missed, especially given that several of these have only made their final decisions within the past week or so.
With the pending dire threat to several of these programs (primarily Medicaid & the ACA) from the House Republican Budget Proposal which recently passed, I'm going a step further and am generating pie charts which visualize just how much of every Congressional District's total population is at risk of losing healthcare coverage.
USE THE DROP-DOWN MENU ABOVE TO FIND YOUR STATE & DISTRICT.
Anthem Blue Cross Blue Shield Won’t Pay for the Complete Duration of Anesthesia for Patients’ Surgical Procedures
CHICAGO – In an unprecedented move, Anthem Blue Cross Blue Shield plans representing Connecticut, New York and Missouri have unilaterally declared it will no longer pay for anesthesia care if the surgery or procedure goes beyond an arbitrary time limit, regardless of how long the surgical procedure takes. The American Society of Anesthesiologists calls on Anthem to reverse this proposal immediately.
Anesthesiologists provide individualized care to every patient, carefully assessing the patient’s health prior to the surgery, looking at existing diseases and medical conditions to determine the resources and medical expertise needed, attending to the patient during the entire procedure, resolving unexpected complications that may arise and/or extend the duration of the surgery, and working to ensure that the patient is comfortable during recovery.
Not a whole lot stands out to me other than SSM Health Insurance apparently dropping out of the states indy market and a new carrier, Bankers Reserve Life Insurance, newly joining it.
At the same time, the Missouri small group market appears to be losing two carriers (or three depending on your POV): Aetna Health, Aetna Life and Cigna Health & Life are all missing from the 2025 filing summaries as well as the federal Rate Review database.
In any event, the MO individual market is looking at average premium reductions of 1.7% if approved as is, while small group plans are likely to increase by about 7.9% overall.
As always, these are subject to state regulatory review and approval.
Thanks to the Biden-Harris Administration’s efforts to strengthen maternal health, an estimated 641,000 Americans annually are now eligible for essential care for a full year after pregnancy.
Yesterday the Missouri Insurance Dept. posted the final/approved filings along with this press release:
Missouri Department of Commerce and Insurance releases health insurance rates for 2024 with more choices for Missourians
Missourians should shop around when looking for health insurance coverage on the individual market; most will find they have many choices for plan year 2024
Jefferson City, Mo – The Missouri Department of Commerce and Insurance (DCI) announces the release of final health insurance rates for Missouri’s 2024 individual market.