

UPDATE: You asked for it, you got it: #COVID19 vaccination levels BY COUNTY, graphed
Tue, 05/25/2021 - 6:21pm
UPDATE 7/04/21: See here for an updated version of the vaccination status of every county nationwide
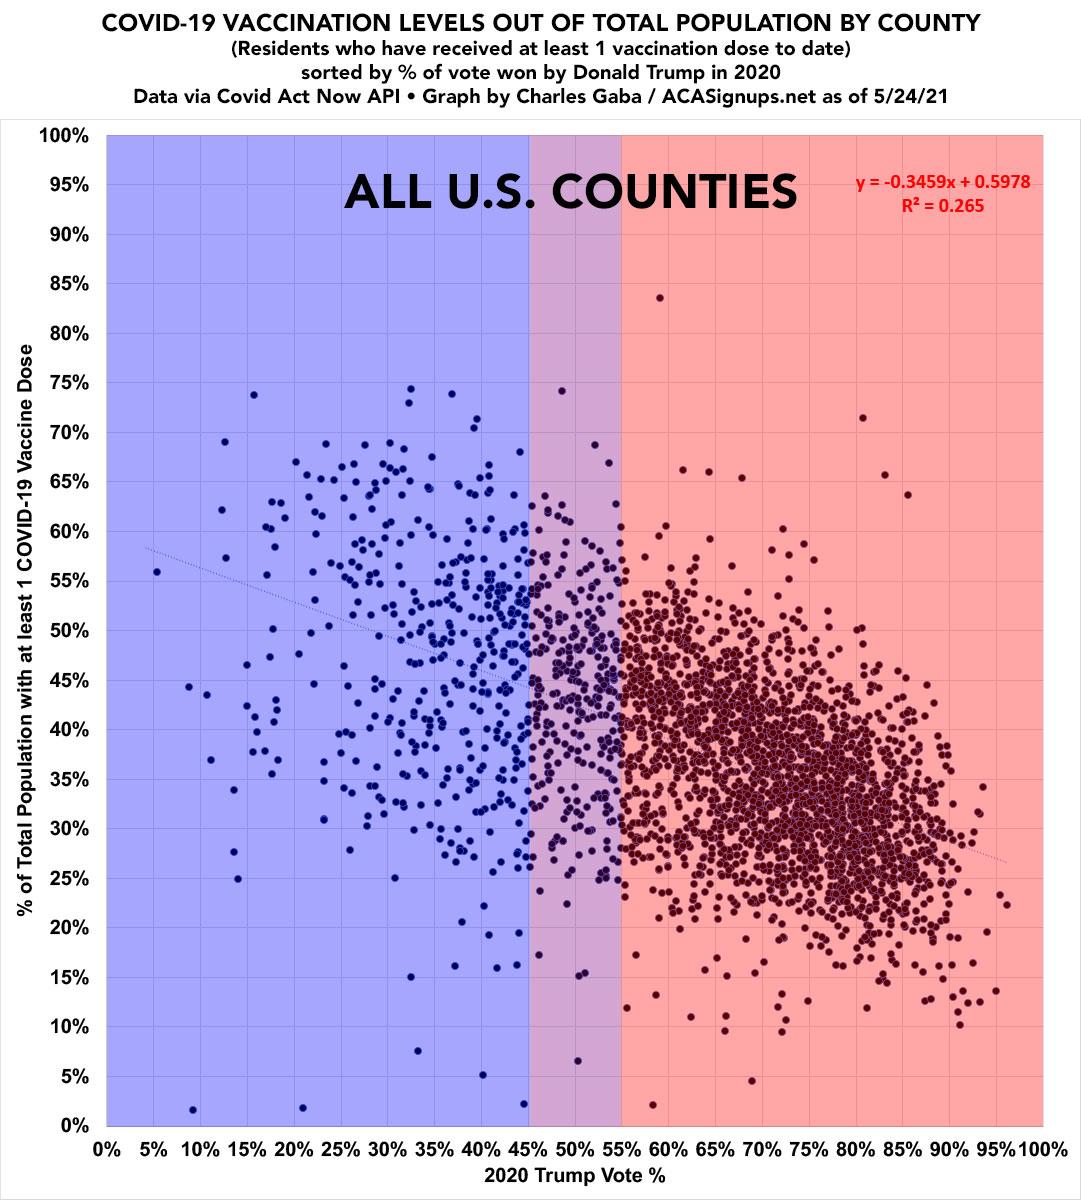
Last week I got a little ahead of myself by attempting to run a scatter plot displaying current COVID-19 vaccination rates across every COUNTY nationwide according to the 2020 election results...all 3,100+ of them.
I had things mostly right, but it turned out I had some data and methodology errors, so I went back to the full list and went over every county more carefully to make sure I cleaned up any errors I could find, mostly thanks to the Federal Information Processing Standards (FIPS) county coding system. It turned out I had some counties swapped with other counties with similar names in the same state, and in a few cases the counties I had listed don't even exist any longer (in Alaska and Virginia especially). I've made as many corrections I could, and have plugged in updated data as of yesterday.
In addition, I've changed my methodology. Last week I used the total doses administered for some states, while in other states where that number wasn't available, I tried to make an estimate of it based on the data I did have. However, this turns out to have larger errors than I'm comfortable with, so I've decided to be more consistent going forward: I'm now using total number of residents who've received at least one dose, which I have the hard data for for every state on a regular basis via the Covid ActNow Risk & Vaccine Tracker database.
The funny thing is, all of these changes didn't make much difference in the end...if anything, the correlation is slightly higher (R2 is up from 0.226 to 0.265).
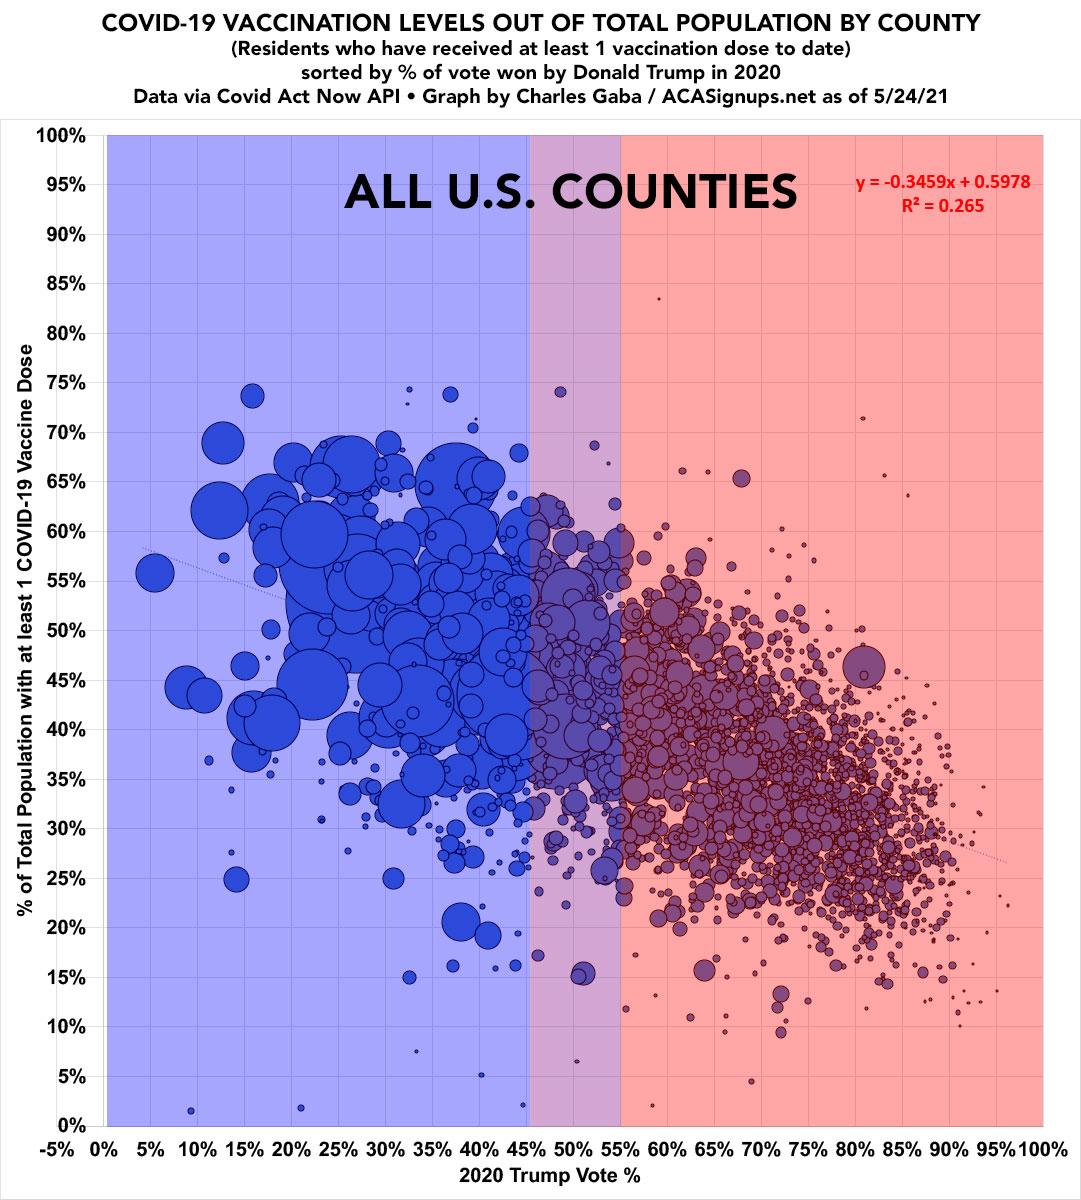
It's important to note that while the second "bubble graph" below has the dots sized according to population, the trend line still hasn't been weighted by population yet. I hope to have that done soon; it'll be interesting to see how much of an impact that makes.
A few key highlights:
- Bristol Bay Borough, Alaska still tops with a stunning 83.5% of their entire population supposedly having been vaccinated already. Of course they only have 836 residents, but still.
- Presidio County, Texas (pop. 6,704) comes in second with 74.3%.
- The seven counties with the lowest level of vaccinations so far are all in South Dakota: Buffalo, Corson, Dewey, Ziebach, Mellette, Todd and Oglala Lakota Counties are all at 7% or lower.
- There's a handful of counties where I don't have any vaccination data at all, so they aren't included: Barnstable, Massachusetts; Dukes/Nantucket, Massachusetts; the Kusilvak Census Area of Alaska; and Kalawao County, Hawaii (which only has 86 residents anyway).
Advertisement
