

Update: U.S. #COVID19 vaccination levels BY COUNTY
Mon, 07/12/2021 - 11:48am
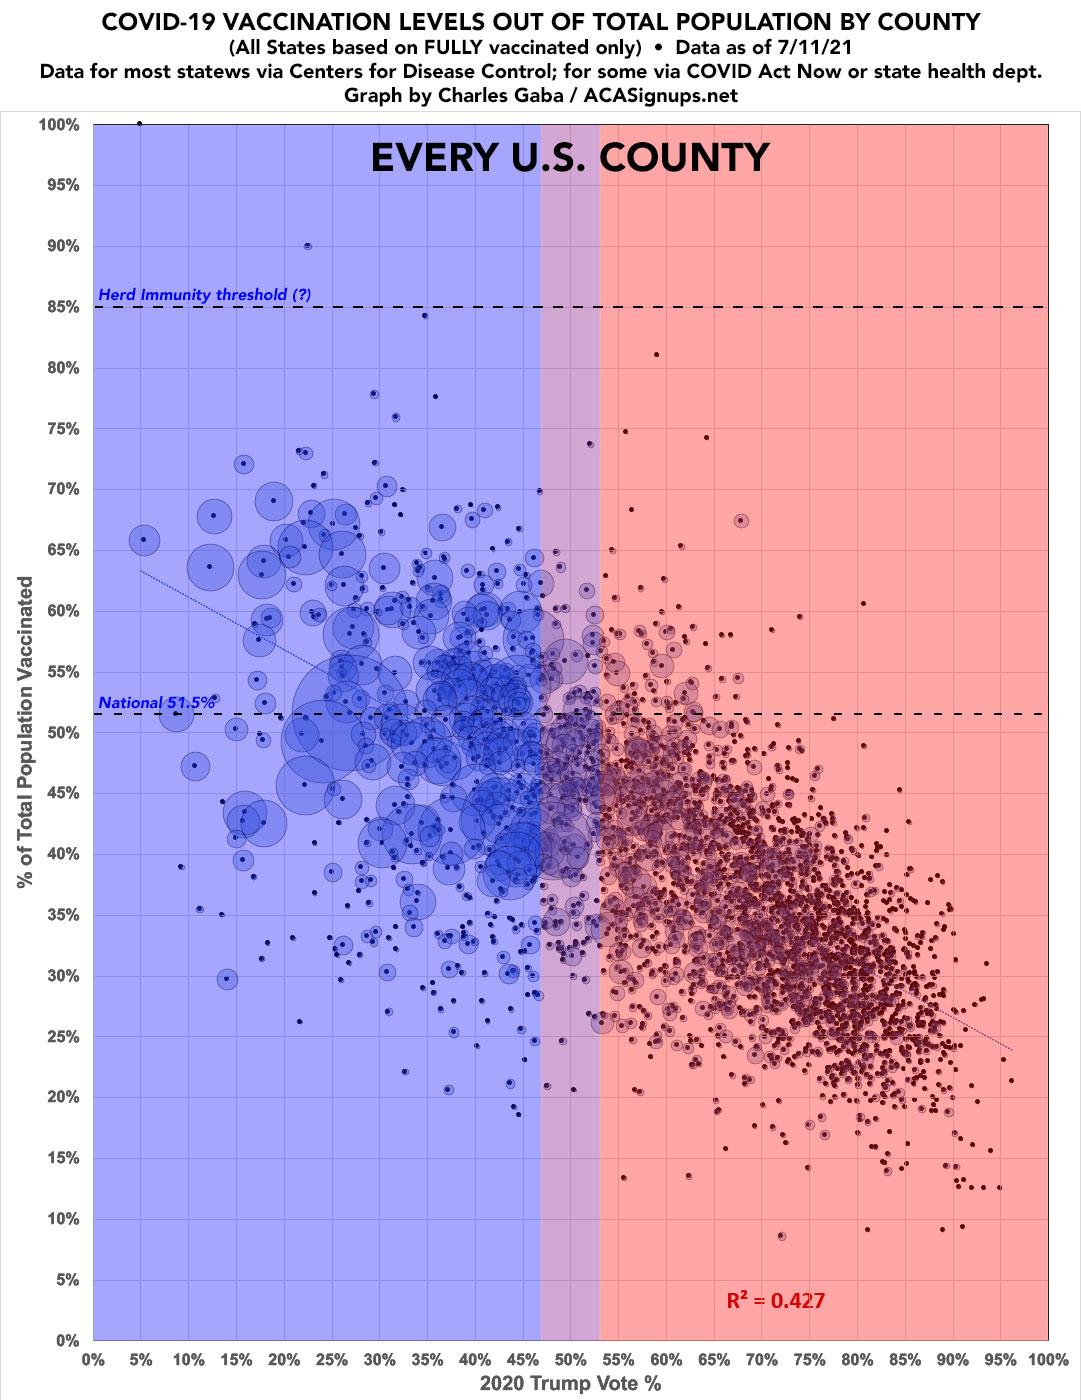
It's been a week since I last ran a scatter plot displaying current COVID-19 vaccination rates across every COUNTY nationwide according to the 2020 election results...all 3,100+ of them.
As I noted last week, with the more aggressive Delta variant now spreading quickly among the unvaccinated in the U.S., 85% of the total population seems to indeed be the more likely threshold which will be needed.
For the updated graph below, I've made a few more tweaks to both my data sources and the graph itself, neither of which makes that much of a difference in terms of impact on the final results:
- In the interest of consistency across all states, I'm now counting those fully vaccinated only in EVERY state, even the ones where I have access to total doses administered (such as Iowa and Michigan). Again, for most states I'm using the daily data from the Centers for Disease Control, but there are some states where the CDC is either missing county-level data entirely (Hawaii, Texas, some counties in California) or where the CDC data is less than 90% complete at the county level.
- For Hawaii, Vermont, Virginia and West Virginia, I'm relying on data from the COVID Act Now Risk & Vaccine Tracker database.
- For Colorado, Georgia, New Mexico and Texas, I'm using their COVID vaccine dashboards set up by the state health departments.
- For California, I'm using the CDC data for most counties and the state health dept. dashboard data for the 8 small counties which the CDC isn't allowed to post data for (it has something to do with state privacy laws, though that doesn't make much sense to me since they post the same data on their own state website).
With all of this in mind, comparing my county-level analysis from May 25th until today reveals a critical change:
- On May 25th, R^2 stood at 0.2650
- On July 3rd, R^2 stands at 0.4216
- On July 11th, R^2 stands at 0.4270
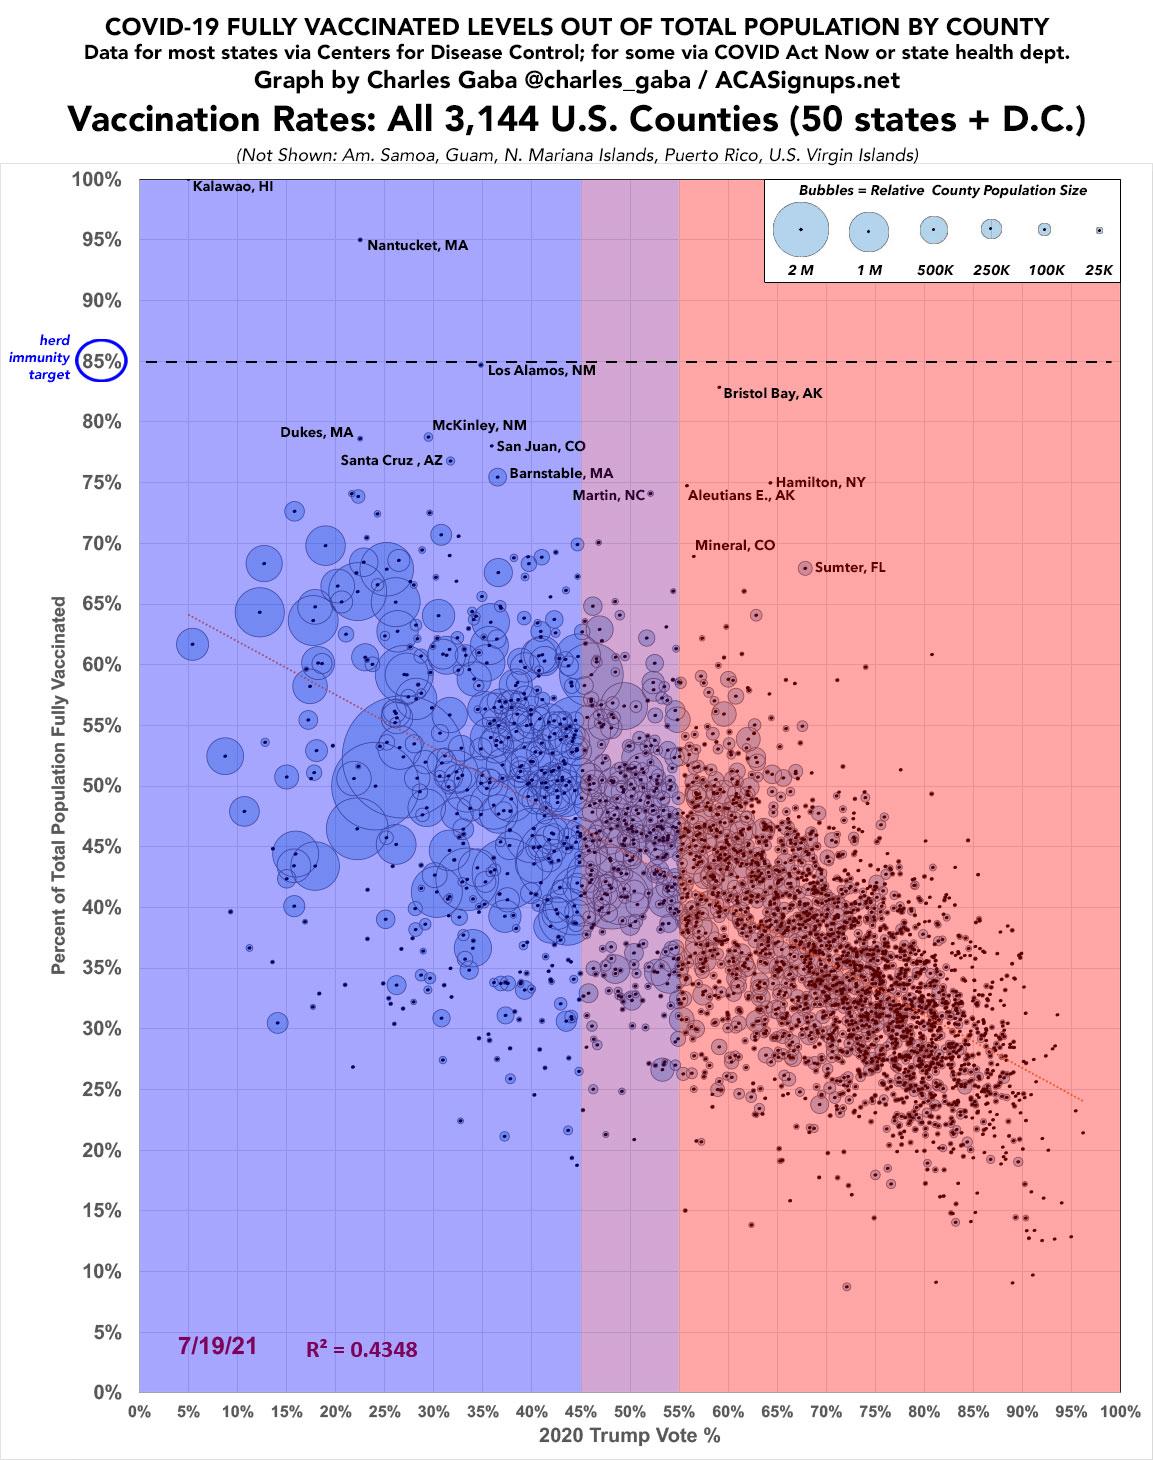
- Update (see below): On July 19th, the R^2 stood at 0.4348
A few key highlights:
- The only county where 100% of the residents appear to have been vaccinated is Kalawao County, Hawaii. Granted, it only has 86 residents and wasn't even listed on the CDC data, but it turns out that all 86 of them appear to have been vaccinated way back in January.
- The data for Dukes and Nantucket, Massachusetts are a bit confusing given the nature of each, but as far as I can tell from this city/town-level tracker, both appear to have vaccinated a good 90%+ of their residents. (Update: See below...Nantucket is at 95%+, Dukes is around 78%)
- Setting these aside, there are only 5 counties nationally which have fully vaccinated more than 75% of their entire populations: Los Alamos, NM; McKinley, NM; Bristol Bay, AK; San Juan, CO; and Santa Cruz, AZ. The total combined population of these (along with Kalawao, Dukes & Nantucket) is 142,000 people.
- At the opposite end of the spectrum, there are 20 counties nationally (with a combined population of 210,000 people) which have vaccinated less than 15% of their populations:
- Winston County, AL; Miller County, AR; Charlton County, GA; Chattahoochee County, GA; Long County, GA; Cameron County, LA; McCone County, MT; Arthur County, NE; Grant County, NE; Logan County, NE; McPherson County, NE; Billings County, ND; Grant County, ND; McKenzie County, ND; Slope County, ND; Holmes County, OH; Harding County, SD; McPherson County, SD; Gaines County, TX and King County, TX
- In fact, four of these have vaccinated fewer than 10% of their populations to date:
- McPherson County, NE (pop. 494): 9.3%
- McPherson County, SD (pop. 2,379): 9.1%
- Slope County, ND (pop. 750): 9.1%
- Miller County, AR (pop. 43,257): 8.6%
Yes, that's right: The third and fourth worst-vaccinated counties in America are both named McPherson. I have no idea what that means.
- While the partisan difference (blue counties have a much higher vaccination rate than red counties) is significant and undeniable, there are a few outliers. There are 13 counties in which Donald Trump received more than 53% of the vote and which have vaccinated at least 60% of their total populations, including:
- Aleutians East, Bristol Bay and Petersburg, AK; Mineral, CO; Sumter, FL (home of The Villages); JoDaviess, IL; Graham, KS; West Feliciana, LA; Emmet & Mackinac, MI; Luna, NM; Hamilton, NY; and Montour, PA
- The total population of these 13 counties is just 264,000, of which 173,000 have been fully vaccinated. Only about 8.8% are under 12 years old, so that's around 68,000 residents who could be vaccinated but haven't been yet (some may have received their first dose).
- Conversely, there are another 26 counties where Trump received less than 47% of the vote which have vaccinated less than 30% of their populations, including:
- Dallas & Russell, AL; North Slope, AK; Crittenden, Jefferson & Lee, AR; Clayton, Liberty & Stewart, GA; Riley, KS; East Carroll, Madison & St. Helena, LA; Clay, MN; Issaquena, Jefferson Davis, Kemper, Tallahatchie, Tunica & Yazoo, MS; Hertford, Hoke & Warren, NC; Sioux, ND; Lee, SC; and Ziebach, SD.
- The total population of these 26 counties is just 953,000, of which 257,000 have been fully vaccinated. 15.9% of the total are under 12 years old, that's around 545,000 residents who could be vaccinated but haven't been yet (some may have received their first dose).
UPDATE 7/19/21: Welcome New York Times readers! I've updated the graph below with the latest vaccination data, which raises the R^2 slightly more to 0.4348. I've also made a few modifications to the layout to clarify that the U.S. territories aren't shown (since they don't vote for U.S. President in the general election), as well as labeling most of the upper-end outliers. This version also breaks out Dukes & Nantucket based on MA town/village-level data. Finally, I've added a key to explain the bubble sizes (relative couinty population):
Advertisement
