

Missouri: Canary in the coal mine for unvaccinated & the #DeltaVariant?
Mon, 06/28/2021 - 10:32am
UPDATED 7/01/21
As my regular readers know, a few weeks ago I dove head first into a 2-week project to graph out the COVID-19 vaccination levels per capita across all 3,100+ counties to see where things stood in all 50 states.
Given how insanely politicized the COVID pandemic has been due to the Trump Administration deliberately doing so right from the outset, I ran scatter plot graphs based on what percent of the popular vote was received in each county by Trump last November for every state.
Sure enough, I found a strong inverse correlation between the two in most states, and a weaker (but still significant) correlation in many others. Correlation does not equal causation, of course, and there are plenty of other factors involved in how rapidly a population gets vaccinated, but there's no denying that partisanship is pretty clearly a significant one.
My conclusions have now been further confirmed by David Leonhardt of the New York Times:
Red America’s Covid Problem
There was a strange Covid-19 pattern in the U.S. for much of this spring. The virus was not spreading any faster in communities with low vaccination rates than in those with high vaccination rates.
...The pattern helped feed an impression among some Americans that Covid was in retreat, regardless of how much progress a community had made in getting shots into arms. In one poll of Tennessee residents last month, 51 percent agreed with the statement that “the Covid-19 pandemic is largely over.”
But the pandemic is not over. Covid remains a serious threat to unvaccinated adults, especially those middle-aged or older. And now the surprising trends from the spring may be coming to an end: Cases have begun to rise more rapidly in communities with lower vaccination rates.
Leonhardt goes on to give me a shout-out regarding Missouri specifically...
Missouri offers the clearest example. Over the past week, it has reported more new Covid cases per capita than any other state, and they are concentrated in rural areas that have low vaccination rates, as Charles Gaba, a health care analyst, has noted. In the parts of the state with high vaccination rates — like the metro areas of Kansas City, St. Louis and Columbia — the number of new cases remains very low.
...and then goes on to cut to the heart of it:
There is a political angle to these trends, of course. The places with the lowest vaccination rates tend to be heavily Republican. In an average U.S. county that voted for Donald Trump, only 34 percent of people are fully vaccinated, according to New York Times data. In an average county that voted for Joe Biden, the share is 45 percent (and the share that has received at least one shot is higher).
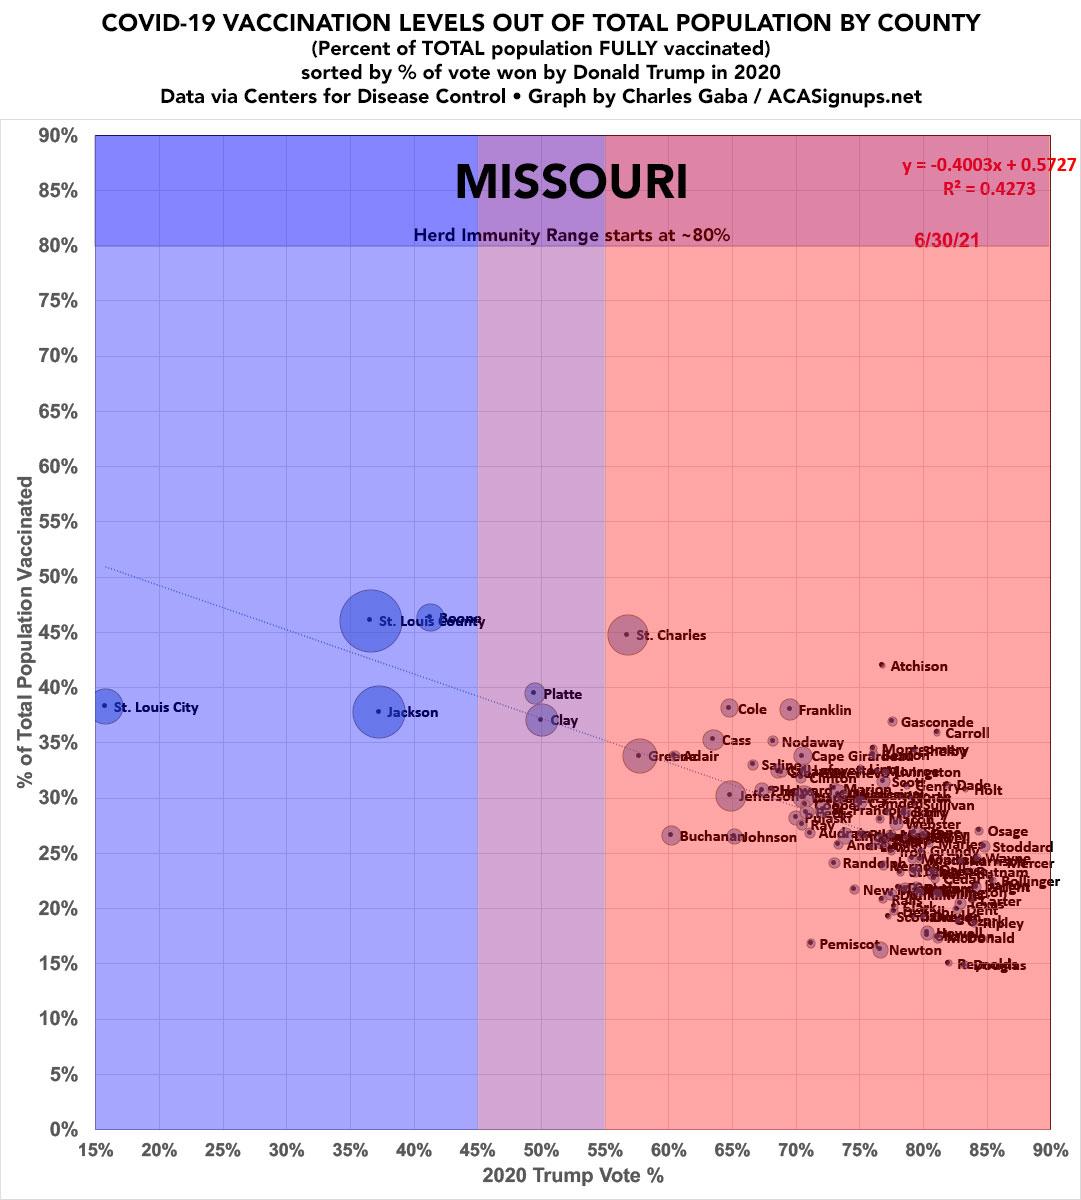
Here's updated versions of the Missouri graphs I posted which Leonhardt was referring to. First, here's a breakout of all 115 Missouri counties (technically 114, but the City of St. Louis is considered a separate "county-equivalent" area from St. Louis County) based on what percent voted for Trump:
Next, here's a similar graph, except instead of measuring the percent of the total population vaccinated, it measures the number of new COVID cases per capita over the past 14 days, again based along Trump vote percent. 2.5/1K would extrapolate out to around 60,000 cases per day nationally:
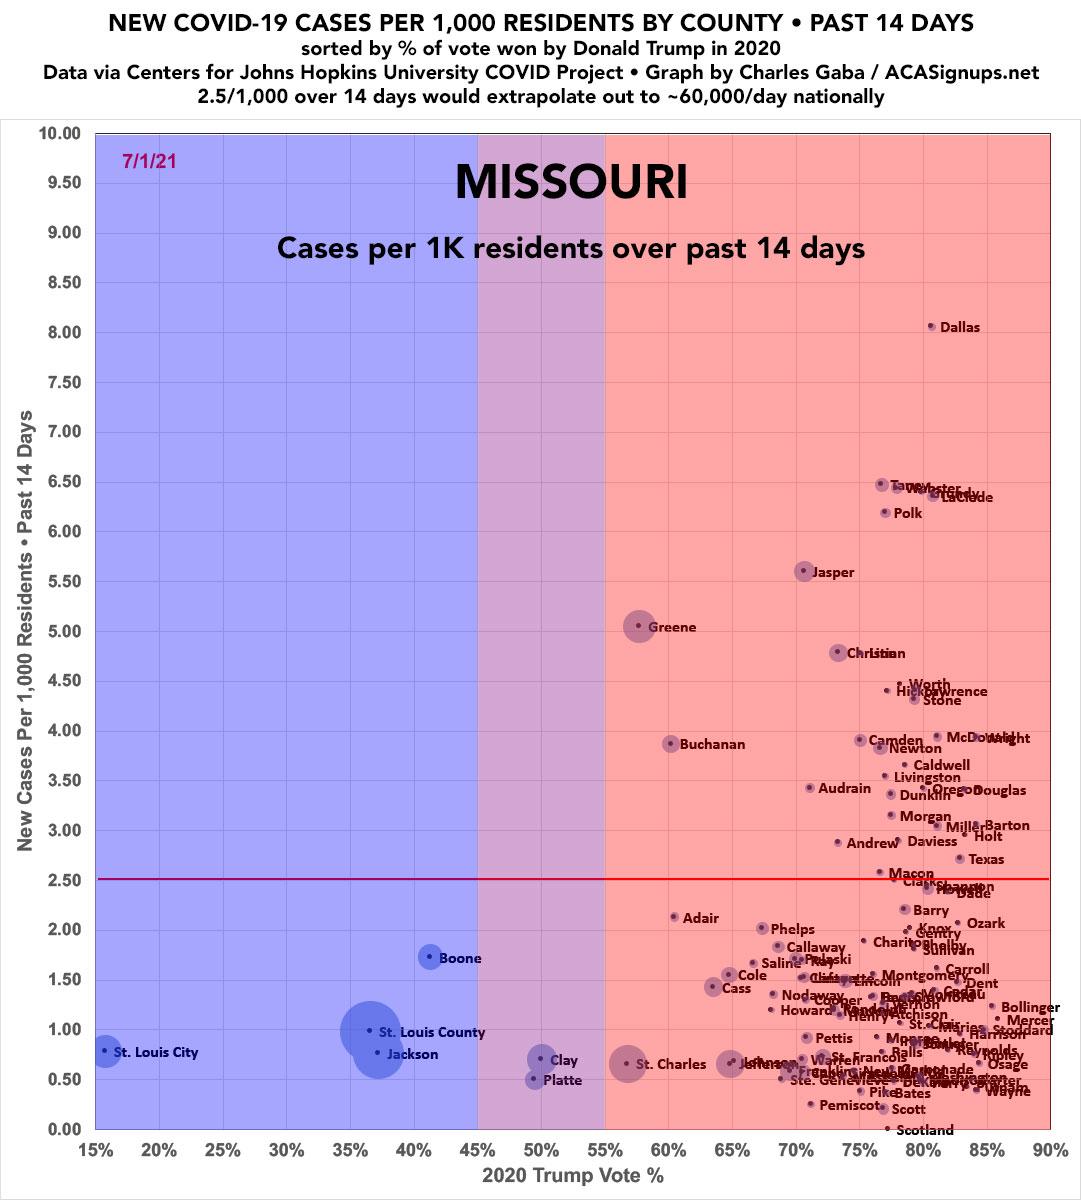
As I said a week or so ago: Yowza. Not one of the counties where Trump received less than 50% of the vote have seen more than 2.5 cases per 1,000 residents over the past month...while 34 of the counties Trump won are over 2.5 per thousand.
Of course, blue counties tend to be far more densely populated (thus the blue circles surrounding the dots); the 6 counties in the blue or purple regions have 2.53 million residents, or 37% of the total state population.
Even so, there are 8 counties which have a 14-day case rate more than double this rate (5/1K or higher) with 600,000 residents...none of which have had more than 1/3 of their residents vaccinated as of today. Dallas County is more than triple (over 8/1K).
Put another way, here's every county in Missouri broken out by the percent of their total population which has been vaccinated. The counties where less than 35% of the population has been vaccinated are seeing new case rates 3x higher than those where more than 35% have been vaccinated:

Advertisement
