

Happy Independence Day. Here's U.S. #COVID19 vaccination levels BY COUNTY
Sun, 07/04/2021 - 10:13am
It's been over a month since I last ran a scatter plot displaying current COVID-19 vaccination rates across every COUNTY nationwide according to the 2020 election results...all 3,100+ of them. With today being the 4th of July, which also happens to be the target date for President Biden's call for at least 70% of all U.S. adults to have received their first vaccination shot.
As many have noted, no, we're not going to quite reach that goal nationally, though many states have already far exceeded it. Nationally, it looks like we're gonna come in at a little over 67% of all U.S. adults.
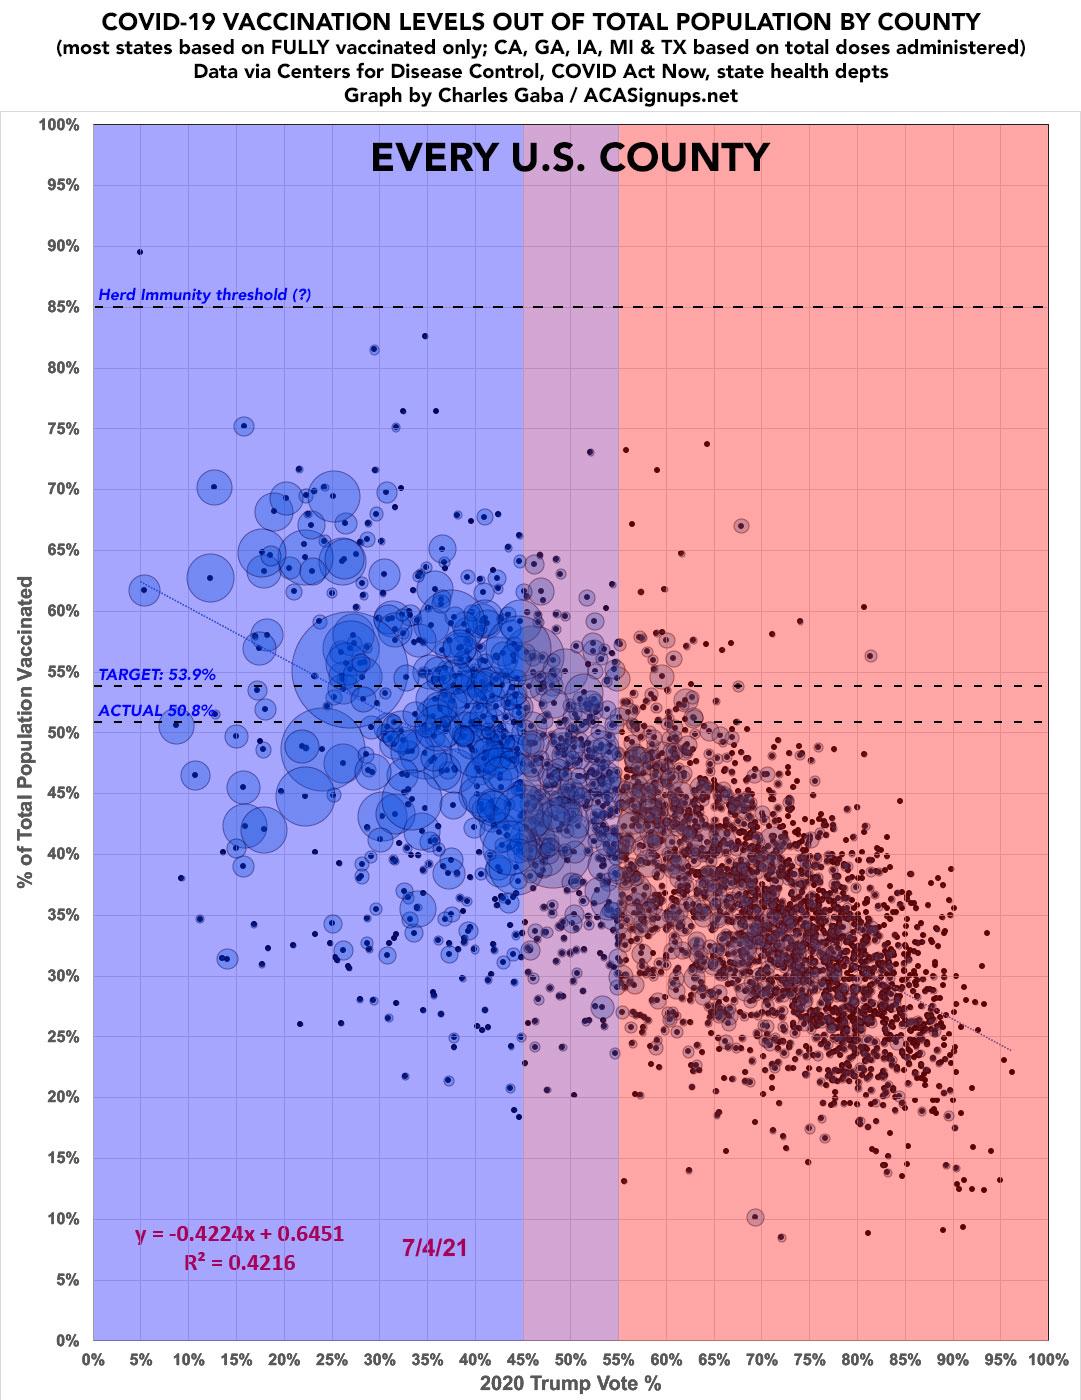
Of course, that target was 70% of all adults, not the entire population. Adolescents age 12- 17 can also get vaccinated...and COVID-19 doesn't care about whether the FDA has approved a vaccine for children under 12 or not. When you divide into the entire U.S. population...which is what really matters in terms of the ultimate goal of reaching herd immunity...the 4th of July target was actually only around 53.9%...and the actual national status as of yesterday was just 50.8%.
The exact vaccination threshold we need in order to achieve herd immunity isn't known. Via the Yale School of Medicine from May 2021:
The percentage of the population that needs to be immune to attain herd immunity varies by disease and how contagious that disease is. Measles, for example, spreads so easily that an estimated 95% of a population needs to be vaccinated to achieve herd immunity. In turn, the remaining 5% have protection because, at 95% coverage, measles will no longer spread. For polio, the threshold is about 80%.
It’s important to note that herd immunity can be measured at the global, national, and community level and changes over time. So, if vaccination rates for a highly contagious disease go down in one pocket of the country, for example, the disease can resurface and spread in that area. “In 2019, there was a measles outbreak in Clark County, Washington, when the vaccination rate in public schools went down to 77 percent. That’s what happens when the vaccination numbers dip,” Dr. Foxman says.
Viruses like the flu, however, are different from measles in that they mutate over time, meaning antibodies from a previous infection won’t provide protection for long. That’s why the flu vaccine is reformulated each year to match what is expected to be the dominant strain in the coming season.
Likewise, the virus that causes COVID-19 has been mutating. While the authorized vaccines are effective against the current strains circulating in the U.S., researchers do not yet know how long immunity to COVID-19 lasts after infection or vaccination. So, a booster shot [an additional vaccine dose] of some kind may well be necessary, Dr. Juthani says.
At the start of the pandemic, figures like 60 to 70% were given as estimates of how much of the population would need immunity from the coronavirus in order to reach herd immunity.
With the increase in variants, which are more infectious and could potentially impact the effectiveness of the vaccines, that percentage is now estimated to be higher—some say up to 85%. And it has become more difficult to pin down.
With the more aggressive Delta variant now spreading quickly among the unvaccinated in the U.S., 85% seems to indeed be the more likely threshold which will be needed.
For the updated graph below, I've made a few more tweaks to both my data sources and the graph itself, neither of which makes that much of a difference in terms of impact on the final results:
- For most states, I'm still counting those fully vaccinated only, based on daily data from the Centers for Disease Control
- For some states, however, the CDC's data is only partial (or completely missing). In Colorado, Hawaii, New Mexico, South Dakota, Vermont, Virginia and West Virginia, the data is still based on fully-vaccinated only, but I'm relying on either the COVID Act Now Risk & Vaccine Tracker database or the state health department's data.
- For California, Georgia, Iowa, Michigan and Texas, I'm counting the total number of doses administered based on the state health department's data.
- On the graph itself, I've made three major changes:
- First, I've overlaid the "population bubble" version on top of the "dot" version to avoid having to maintain two separate graphs.
- Second, I've made the Y-axis taller to make it easier to see the individual counties.
- Third, I've added 3 dotted horizontal lines representing where the national threshold stands today, where President Biden's 4th of July target is, and the 85% herd immunity target.
With all of this in mind, comparing my county-level analysis from May 25th (over 5 weeks ago) until today reveals a critical change:
- On May 25th, R^2 stood at 0.2650
- On July 3rd, R^2 stands at 0.4216
A few key highlights:
- The county with the highest vaccination rate appears to be one which I previously thought had the lowest rate: Kalawao County, Hawaii (it only has 86 residents and wasn't even listed on the CDC data, but it turns out that basically all 86 of them were already vaccinated way back in January. I'm only listing them at 90% for the moment since the article doesn't explicitly state that everyone there has been vaccinated).
- Setting Kalawao aside, there are only two counties with vaccination rates over 80% of the total population...both of which are in New Mexico: Los Alamos and McKinley, which stand at 82.6% and 81.5% respectively.
- At the opposite end of the spectrum, there are 21 counties nationally which have vaccinated fewer than 15% of their populations:
- Shelby County, AL; Winston County, AL; Miller County, AR; Charlton County, GA; Chattahoochee County, GA; Long County, GA; Cameron County, LA; McCone County, MT; Arthur County, NE; Grant County, NE; Logan County, NE; McPherson County, NE; Billings County, ND; Grant County, ND; McKenzie County, ND; Slope County, ND; Holmes County, OH; Harding County, SD; McPherson County, SD; Gaines County, TX and King County, TX
- In fact, four of these have vaccinated fewer than 10% of their populations to date:
- McPherson County, NE (pop. 494): 9.3%
- Slope County, ND (pop. 750): 9.1%
- McPherson County, SD (pop. 2,379): 8.9%
- Miller County, AR (pop. 43,257): 8.5%
Yes, that's right: The second and fourth worst-vaccinated counties in America are both named McPherson. I have no idea what that means.
- While the partisan difference (blue counties have a much higher vaccination rate than red counties) is significant and undeniable, there are a few outliers. There are 13 counties in which Donald Trump received more than 50% of the vote and which have vaccinated at least 60% of their populations, including:
- Aleutians East, Bristol Bay and Petersburg, AK; Mineral County, CO; Litchfield, CT; Sumter County, FL (home of The Villages); JoDaviess County, IL; Graham County, KS; West Feliciana Parish, LA; Luna County, NM; Hamilton County, NY; Martin County, NC; and Montour County, PA
- Of these, only two of them have populations higher than 100K: Litchfield CT (180K) and Sumter FL (132K).
- Conversely, there are another 13 counties where Trump received less than 50% of the vote which have vaccinated less than 25% of their populations, including:
- Russell County, AL; Crittenden, Jefferson & Lee Counties, AR; Liberty County, GA; St. Helena Parish, LA; Kemper & Tallahatchie Counties, MS; Anson, Hertford & Hoke Counties, NC; Jasper County, SC; and Ziebach County, SD.
- Of these, none have populations higher than 67,000 people.
Advertisement
