Preliminary Information Shows Even Greater Savings in 2022: 24.1% Savings from Bipartisan Reinsurance Program
DENVER - Governor Polis and the Colorado Division of Insurance (DOI), part of the Department of Regulatory Agencies (DORA), released preliminary information about the health insurance plans and premiums for 2022, for the individual market (meaning health insurance plans for people who don’t get their insurance from an employer) and the small group market (for small businesses with 2-100 employees).
17,000 Nevadans Saved on Health Insurance Plans Through Nevada Health Link
The online insurance marketplace increased total enrollments by 7.6% during American Rescue Plan Enrollment Period
CARSON CITY, Nev. (Aug. 23, 2021) – Nevada Health Link, the online health insurance marketplace operated by the state agency, the Silver State Health Insurance Exchange (Exchange), announced that more than 17,000 Nevadans took advantage of premium savings during an Open Enrollment Period (OEP) created by the American Rescue Plan Act (ARPA or American Rescue Plan).
Due to the COVID-19 pandemic and efforts to ensure more Americans are covered by health insurance, The American Rescue Plan Act was signed into law on March 11 of this year, allowing uninsured Nevadans additional opportunities to enroll in health insurance benefits along with significant savings. Customers who were already enrolled also had the opportunity to take advantage of increased subsidies through the Nevada Health Link marketplace.
Last week I noted that MNsure, Minnesota's state-based ACA exchange, announced that while the general, open-ended 2021 Special Enrollment Period had ended back in mid-July, they're still letting any Minnesotan who received unemployment benefits at any point in 2021 the opportunity to enroll in ACA healthcare coverage & take advantage of the American Rescue Plan's Unemployment Benefit.
The key point is that Minnesotans can still do so even if they received UI benefits prior to the July 15th SEP deadline. This means that if you were on unemployment back in, say, January or February, and you still need healthcare coverage for the remainder of 2021, you can still visit MNsure.org and get coverage for the last 4 months of this year for $0 in premiums and with mostly nominal deductibles/co-pays (assuming you aren't eligible for employer-based coverage, Medicaid, etc. instead).
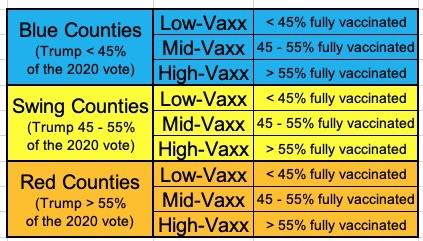
At the time I was mostly interested in looking at the outlier counties--the poorly-vaccinated solidly blue counties and the highly-vaccinated solid red counties.
I also noted that, to no great surprise, the makeup of those 146 "Blue Low-Vaxx" counties is pretty telling:
CMS tells Inside Health Policy that it will be releasing a final report on its COVID-19 Special Enrollment Period in September and points out that consumers who submitted their applications by the Aug. 15 SEP deadline still have 30 days to select a plan. Additionally, staffers are contacting the “very small group” of consumers who reached out to the Marketplace Call Center just before the deadline but were unable to get through to a representative so that those individuals have a chance to enroll, the agency confirms.
The final report was obvious, since the 2021 "No Excuses Needed" SEP still ran through August 15th in most states (and is still ongoing in a few), but I figured they'd come out with it in late August, not September.
I admit that I didn't know (or had forgotten?) about those who submitted their apps prior to 8/15 still having a full month to select a plan. Granted, if they wait until mid-September their coverage won't start until October, giving them just 3 months to use up a full 12-month deductible, but still.
NJ DOBI Announces Grant Opportunity for Navigators to Assist New Jerseyans With Health Insurance Enrollment
Open Enrollment Period at Get Covered New Jersey Begins November 1, 2021
TRENTON – The New Jersey Department of Banking and Insurance today announced it is now accepting applications for community organizations to serve as Navigators to assist residents with health insurance enrollment for the upcoming Open Enrollment Period and during 2022. The department is making available a total of $4 million in grant funding for Navigators, in an effort to ensure enrollment assistance is available in the community for residents seeking coverage through Get Covered New Jersey, the state’s official health insurance marketplace, during the Open Enrollment Period that starts November 1, 2021 and through the year.
Insurance companies offering individual and small group health insurance plans are required to file proposed rates with the Arkansas Insurance Department for review and approval before plans can be sold to consumers.
The Department reviews rates to ensure that the plans are priced appropriately. Under Arkansas Law (Ark. Code Ann. § 23-79-110), the Commissioner shall disapprove a rate filing if he/she finds that the rate is not actuarially sound, is excessive, is inadequate, or is unfairly discriminatory.
The Department relies on outside actuarial analysis by a member of the American Academy of Actuaries to help determine whether a rate filing is sound.
Below, you can review information on the proposed rate filings for Plan Year 2022 individual and small group products that comply with the reforms of the Affordable Care Act.
Highlighting Michigan’s increasingly competitive health insurance market, the Michigan Department of Insurance and Financial Services (DIFS) has reported that consumers will have more health plan options from an increased number of insurers on the Health Insurance Marketplace for the upcoming open enrollment period.
“As we look toward the end of the pandemic and beyond, it is critical that Michiganders are able to get the affordable, high quality health coverage they need for themselves and their families,” said DIFS Director Anita Fox. “Consumers will have more options to choose from when shopping for health insurance coverage on the Marketplace during open enrollment later this year.”
Covered California’s enrollment continues to surge — with 364,000 signing up since February, more than double normal enrollment rates — as more people sign up for coverage to benefit from the new savings and lower premiums available through the American Rescue Plan.
Lower-income households are getting a quality plan for an average of $35 per month, with more than 738,000 people getting brand-name plans for just $1 per month.
Middle-income consumers, who were previously ineligible for federal financial help, are saving an average of nearly $800 per month and seeing their monthly premiums reduced by more than 70 percent.
Covered California’s increased enrollment includes a higher proportion of African American and Latino Californians, two of the communities hit hardest by the COVID-19 pandemic and ensuing recession.
Those who enroll by Aug. 31 would be insured starting Sept. 1.
DIFS Files Cease and Desist Order Against Health Care Sharing Ministry, Connected Businesses Operating in Michigan
(LANSING, MICH) The Michigan Department of Insurance and Financial Services (DIFS) has issued a cease-and-desist order against a healthcare sharing ministry and two connected companies for allegedly acting in violation of the Michigan Insurance Code.
“Health care sharing ministries can have a role in fostering the health, fellowship, and sense of community for individuals of faith, but they must follow the requirements of the law,” said DIFS Director Anita Fox. “The DIFS investigation showed that the companies under this cease-and-desist order are essentially operating as unlicensed health insurance companies, in violation of the Insurance Code.”