

Updated: Ay, PAPI! Does the American Rescue Plan include the Premium Adjustment Percentage Index or not?
Tue, 03/09/2021 - 10:29am
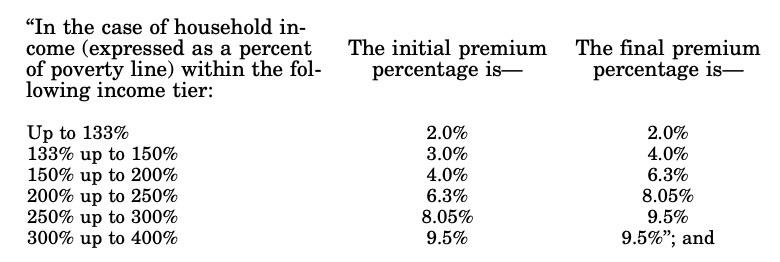
If you look at the actual legislative text of the final version of the Patient Protection & Affordable Care Act (PPACA, or simply ACA), the table describing the applicable maximum percentage of income that exchange-based enrollees have to pay for their premiums looks like the table below:
(Notably missing is the lower-bound 100% FPL subsidy eligibility cut-off; there's a separate section of the law which notes the 100% threshold but makes an exception for certain lawfully-present immigrants who earn less than 100% FPL but who aren't eligible for Medicaid for various reasons and are given an exception).
However, the actual Advance Premium Tax Credit (APTC) table for 2021 specifically looks like this:
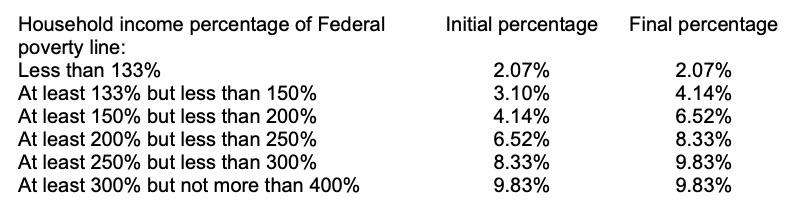
What's going on here? Well, the seemingly arbitrary, slightly-higher percentages are due to something called the Premium Adjustment Percentage Index, or PAPI (yes, I know):
As explained in IRS Rev. Proc. 2014-37, the original 9.5% affordability percentage is annually adjusted after 2014. For years prior to 2020, this adjustment reflected the ratio of the premium growth rate for employer-sponsored health coverage to the national income growth rate in the previous year. For calendar years 2020 and beyond, the Notice of Benefit and Payment Parameters for 2020 changes the method of calculating the “premium adjustment percentage” to capture premium increases for both individual-market policies and employer-sponsored health coverage.
Because premiums for individual-market and employer-sponsored health coverage increased at a greater rate than the national income growth during 2020, the 2021 affordability percentage will be higher than the 2020 level.
Here's the exact definitions from the IRS:
.01 Premium Growth for the Preceding Calendar Year means the quotient determined by dividing the projected per enrollee spending for employer-sponsored private health insurance for the preceding calendar year by the projected per enrollee spending for employer-sponsored private health insurance for the calendar year two years prior. The projections are the National Health Expenditure Projections published by the Centers for Medicare and Medicaid Services Office of the Actuary.
.02 Income Growth for the Preceding Calendar Year means the quotient determined by dividing the projected GDP per capita for the preceding calendar year by projected GDP per capita for the calendar year two years prior. The projections are the National Health Expenditure Projections published by the Centers for Medicare and Medicaid Services Office of the Actuary.
.03 Adjustment Ratio means the quotient determined by dividing (1) the premium growth for the preceding calendar year by (2) the income growth for the preceding calendar year.
I think this is how it works: Let's say that average health insurance premiums paid per capita increase by 6% this year, while GDP per capita increased by 5% vs. last year. That would give you a 1.2x quotient. If premiums went up 4% per capita while GDP went up 5%, that'd give a quotient of 0.8x.
The actual quotients tend to be much smaller than this, but the result is that each year, the actual APTC table jumps up or down slightly (yes, it's actually gone down a bit in a couple of years).
Adding to the confusion, a couple of years ago, Trump's CMS Administrator threw individual market policy premiums into the formula as well, which resulted in an even less generous modifier (although it's conceivable that this could also make it slightly more generous depending on the year).
WHY was this added? I'm assuming it was thrown in to humor some "fiscally conservative" Blue Dog Democrats back in 2009-2010 to win over their vote. Personally I think it's kind of stupid and irritating (it's confusing to have to change these weird hundredths-of-a-percent changes each year). I'm also not sure what the point is of going through all this trouble to "save" what likely amounts to perhaps a couple hundred million dollars per year when the whole point of APTC is to spend tax dollars on subsidies to make the policies more affordable.
Put simply, if they wanted to make benchmark premiums max out at 9.8% of income instead of 9.5%, why not just write that into the law instead of including this weird, convoluted nickel 'n dime formula?
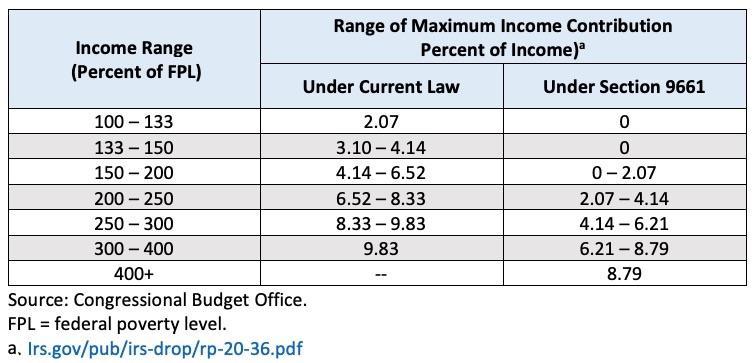
Under the American Rescue Plan, the PAPI modifier looks even sillier. Here's how the modified APTC table is written under HR 1319 (for 2021 - 2022 only):

Simple, cut 'n dry, right? Except that the Congressional Budget Office score of the bill assumes that the PAPI modifier will still be in effect here:
So, is the actual maximum percent anyone pays 8.5% this year, or will it be 8.79%? I've gotten different answers depending on who I've asked.
How much of a difference does this make in the real world? Well, at the lower tiers, not much. For a single adult:
- At 200% FPL, 2.0% of income = $510.40; 2.07% = $528.26, or $17.86/year more
- At 300% FPL, 6.0% of income = $2,296.80; 6.21% = $2,377.19, or $80.39/year more
- At 400% FPL, 8.5% of income = $4,338.40; 8.79% = $4,486.42, or $148.02/year more
These are pretty nominal amounts, so I don't think most folks are gonna complain too much (especially since they'll still be saving hundreds or thousands of dollar more than they are under the current APTC formula). It just seems like it's adding an extra layer of complexity for no useful purpose to me.
To be fair, the PAPI adjustment is also used to determine a couple of other things like the Maximum Out of Pocket (MOOP) ceiling enrollees are capped at...and for that, the change can mean a difference of hundreds of dollars in potential extra expenses, even at lower income thresholds, so it's more important than I'm making it out to be. Still, the larger point remains: If Congress wants to require enrollees to have to have a higher MOOP threshold, why not just write that into the law itself?
UPDATE: (sigh) Never mind...looks like the CBO corrected themselves...h/t farmbellpsu in the comments for the heads up...
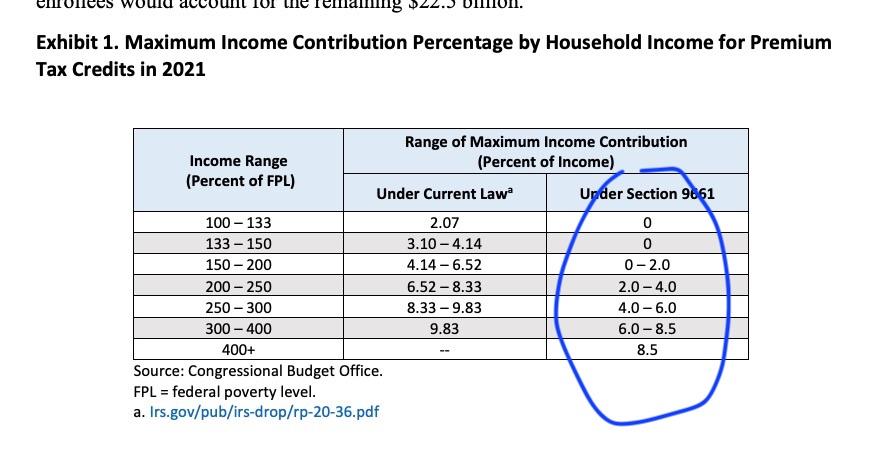
Interestingly, while the CBO updated the table, they didn't make any changes to their estimate of the budgetary impact...the "Premium Tax Credit" estimates for 2021, 2022, 2023 & 2024 are exactly the same as they were before.
That means that either the difference is too small to bother counting (which kind of illustrates my point about how pointless the PAPI is in the first place), or that the estimate was correct but the table was wrong, or that they just didn't see any point in modifying the total budget impact at this point since the bill has already passed both the House and Senate anyway.
Advertisement
