

Exchange Enrollment & Medicaid Expansion: A quick follow-up
Tue, 01/12/2021 - 5:58pm
Back on December 19th, my colleagues Colin Baillio and Andrew Sprung picked up on something I had posted in response to the semi-final 2021 Open Enrollment snapshot report:
STATE LEVEL:
--25 out of 36 states outperformed last year
--Best % increase y/y: TEXAS (+14.9%)
--Worst $ decrease y/y: KENTUCKY (-6.7%)I have no idea if there's anything special in either state which caused either to do as well/poorly as they did relative to last year.
Sprung decided to look into it further. He broke out the states between Medicaid expansion and non-expansion states, and voila:
From the state totals one obvious pattern leaps out: enrollment is up 9.7% in states that have not enacted the ACA Medicaid expansion -- and down 0.5% in states that have expanded the expansion (including Nebraska, which opened the Medicaid expansion doors in October of this year).
As he pointed out (and I later expanded upon), due to the 100% - 138% FPL income overlap in ACA subsidy eligibility and the way that Medicaid expansion works, states which haven't expanded Medicaid under the ACA are likely to see a greater increase in subsidized exchange enrollment during tough economic times (like, say, a global pandemic) than states which have expanded Medicaid, since those seeing a substantial income drop (down to the 100 - 138% range) have nowhere else to go in nonexpansion states whereas in expansion states they're shifted over to Medicaid by design.
At the time, Sprung concluded, using my data, that exchange enrollment in the 14 remaining non-expansion states had increased by 9.7% year over year, while enrollment in the 22 states hosted by HealthCare.Gov which have expanded Medicaid were running about 0.5% behind 2020 enrollment.
However, this doesn't included the other 14 states (+DC) which operate their own exchanges...all of which have also expanded Medicaid. Of those, eleven still haven't completed Open Enrollment, and of the remaining four, only Maryland and Minnesota have actually published their final enrollment data (Idaho and Vermont are radio silent so far).
In the tables below, I've plugged in those two states as well as updating the HC.gov states on both tables with the just-released final OEP 2021 numbers, which are, surprisingly, slightly higher than the semi-final data released after 12/15:
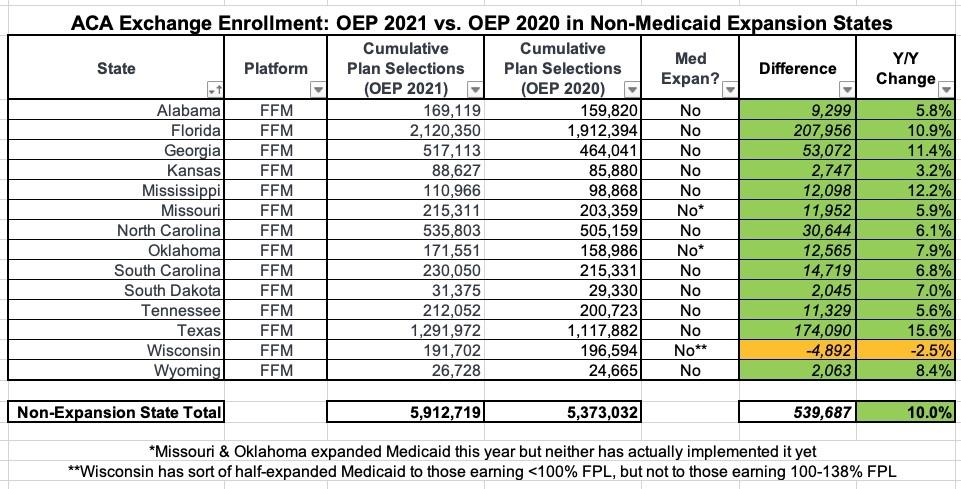
With the updated numbers for 2021 plugged in, enrollment in non-expansion states is an even 10.0% higher than last year.
As Sprung notes, and as i mention above, even Wisconsin's slight drop makes sense given that they're sort of half expansion/half non-expansion.
The Expansion State table, however, is different.
With Maryland and Minnesota added, average Expansion State enrollment year over year goes from -0.5% to +0.3%, a slight improvement. The full picture won't be known until the other 13 SBM states release their final OEP data, of course.
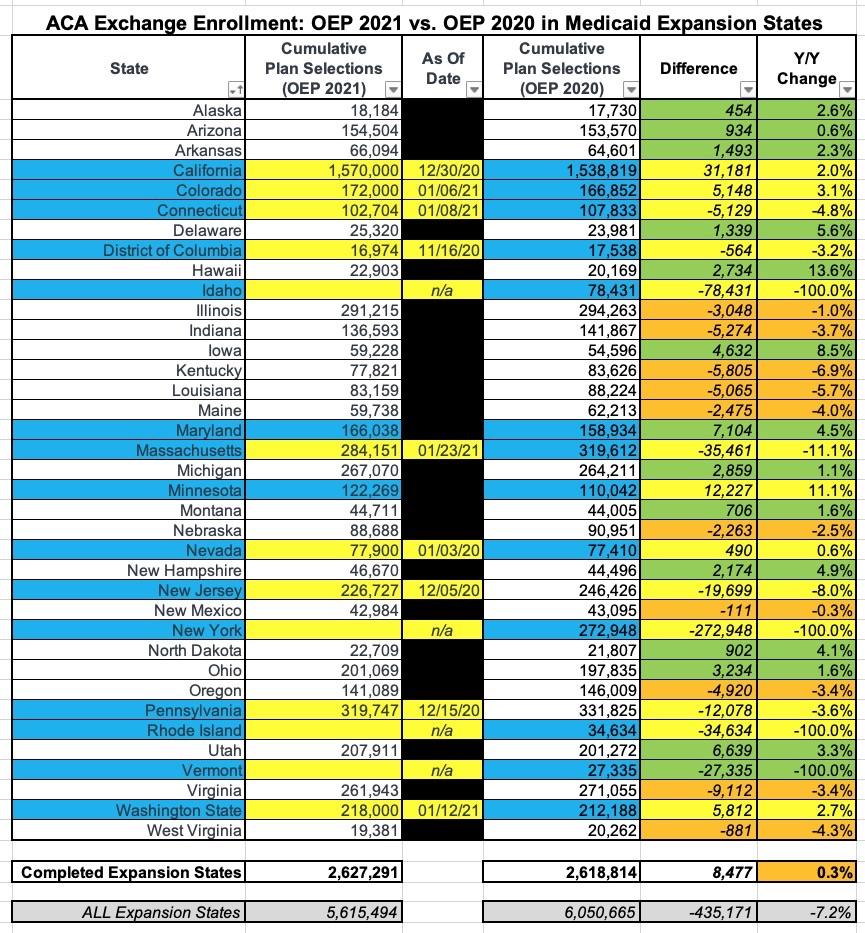
Again, that apparent "7.2% drop" in grey is meaningless since Idaho, New York, Rhode Island and Vermont haven't provided any data yet, while the numbers from CA, CO, CT, DC, MA, NV, NJ, PA & WA are only partial for now. Assuming the final enrollment numbers for the missing states come in where I expect them to, the expansion states will likely end up with around 6.1 - 6.2 million enrollees, 1-2% higher than last year.
If so, this would still make the Medicaid expansion/non-expansion theory valid (+10.0% vs. +1.5% or so), just not quite as dramatically.
I said last month that I'd be surprised if the final HC.gov enrollment total dropped by more than 10,000 people from the semi-final report relative to OEP 2020, but it turned out that I was still wrong: Final enrollment via the federal exchange is actually around 17,000 higher than it was in the semi-final report, which is surprising but welcome.
Advertisement
