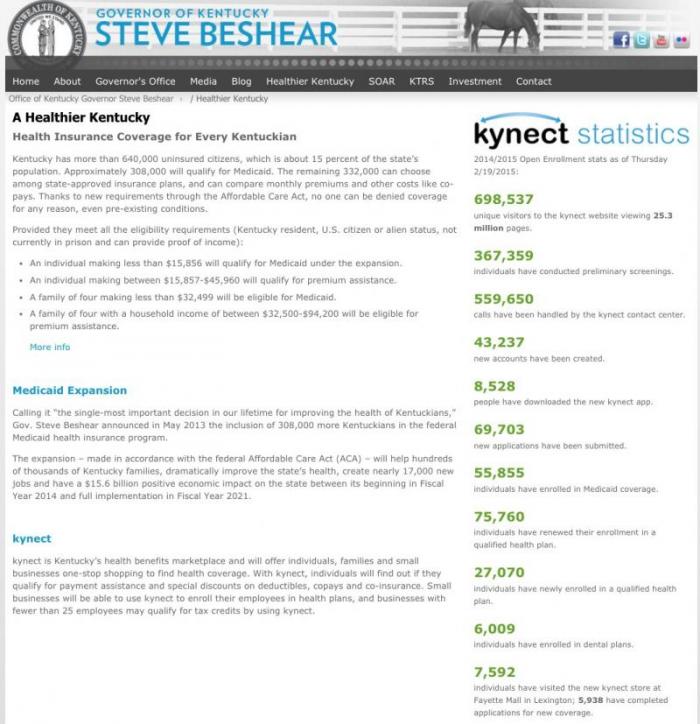
The short version is that about 710,000 enrollees forgot to file a tax return at all (or didn't even know they were required to do so). Another 760,000 did file their taxes, but forgot to include the extra Form 8962 which was required to reconcile their 2014 tax credits (one of those happened to be, ahem...me).
OK, this is pretty nifty! You know those way-cool interactive color-coded maps that you see on major media sites like the NY Times? The ones where you can roll over each state and get pop-up data, etc?
Well, a company called Graphiq which specializes in exactly these maps has done just that with some of my data. The map below shows the percentage of those eligible to enroll in ACA exchange policies who were enrolled as of June 2015. Obviously these numbers have likely shifted since June, and will look quite different starting in January, but this is the most recent hard data available.
Not an official data update, but a nice catch from Louise Norris (the article is mainly about MNsure bumping out their enrollment deadline from 12/15 until 12/28):
As of Sunday, MNsure reported 26,532 sign-ups in private insurance policies through the exchange, including 18,595 new enrollees. The overall sign-up tally is up by more than 8,800 people in a five-day period, and the new enrollee figure is up by 6,415 people.
COVERED CALIFORNIA ENROLLMENT EXCEEDS 140,000 AS CRITICAL DEADLINE FOR COVERAGE APPROACHES
Consumers Must Enroll by Midnight on Dec. 15 to Be Covered on Jan. 1
SACRAMENTO, Calif. — With just one day remaining to enroll for health insurance starting in January, Covered California announced that more than 140,000 consumers had enrolled in coverage by the end of Sunday, Dec. 13.
“Once again, Covered California is seeing an incredible surge of interest, and thousands of people are enrolling at storefronts, insurance agent offices and community centers across the state every day,” Covered California Executive Director Peter V. Lee said. “Everyone who needs health insurance, or knows someone who does, should know they can get financial help to pay for top-brand health insurance coverage, and if they enroll by Dec. 15, their coverage can start on Jan. 1.”
Although open enrollment runs through Jan. 31, 2016, consumers must enroll by midnight Dec. 15 to have their coverage start by New Year’s Day.
HOWEVER, assuming that both the Week Six total as well as the "spike" trend I projected turn out to be accurate, that means that these final days should be playing out something like the following:
Sunday, 12/13: Around 350K nationally (270K via HC.gov)
Monday, 12/14: Around 460K nationally (350K via HC.gov)
Tuesday, 12/15: Around 780K nationally (600K via HC.gov)
Yes, that's right, it's conceivable that HealthCare.Gov could see up to 600,000 people select private policies in a single 24-hour period tomorrow, plus up to another 180,000 via the various state exchanges.
A few weeks ago, I attempted to figure out at what point the cost of paying for healthcare policy premiums would start to outweigh the Shared Responsibility Mandate Penalty for not having ACA-compliant coverage for 2016. For my own experiment, I was looking purely at the "young invincible" target market: Single, childless individuals between 26-35 years old, earning between $20K - $40K. I ran "real world" checks across 10 major U.S. cities. My conclusion was that for this market in particular, signing up through the ACA exchanges was obviously the smart play up until they hit around $25,000/year in income. After that it started to become more of a judgment call depending on their circumstances and how much of a gamble with their health they're willing to take.
Last month, right at the launch of the 2016 Open Enrollment Period, HealthCare.Gov announced that they were beta-testing a couple of important new tools via a pilot program:
Beginning today, HealthCare.gov is piloting a new beta feature that allows consumers to search plans by their preferred provider or health facility. Some consumers will be part of a pilot that allows them to use the beta Doctor Lookup feature as they compare their coverage options in window shopping or when selecting a plan.
...For the first time, insurers are required to provide up-to-date information about which doctors and facilities are in their networks. Plans must also provide access to information on what medications are covered in the health plan formulary. In the coming weeks, HealthCare.gov expects to pilot the Prescription Drug Check feature, as well, which will allow consumers to search for whether a plan covers their prescription drugs.
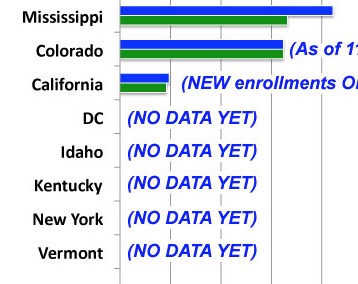
If you take a look at the State-by-State chart, you'll notice that in addition to a few clarifications here and there, there are 5 states (well, 4 states +DC) all the way at the bottom labelled "NO DATA YET".
California insists, just like last year, on doing this weird thing where they release the number of new enrollees who have signed up on a fairly regular basis, but the number of renewals by current enrollees is kept a secret all the way into January. I have no idea why they do that, and it's pretty important given that we're likely talking about somewhere between 1.0 - 1.3 million people here.
On the other hand, at least they've posted data on their new additions. DC, Idaho, Kentucky, New York and Vermont haven't even done that much as of this writing.