I have a doctor's appointment myself this afternoon which I have to leave for soon (irony!!), so the second half of my weekly analysis (state level) will have to wait until I get back, but here's the major story.
With the December 15th deadline just 1 week away and the December Surge starting to kick in, CMS decided to hold a full press conference call this morning ahead of the Week 5 HC.gov Snapshot report.
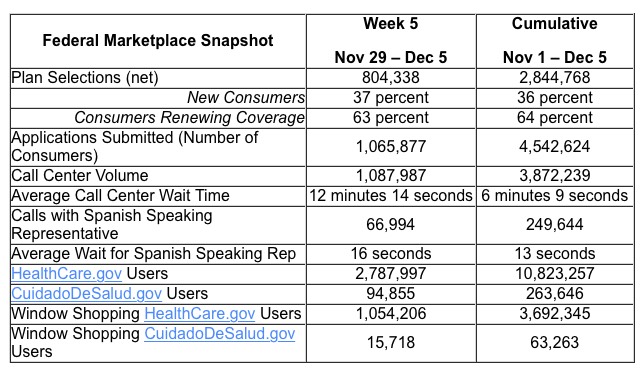
UPDATE 12/03/15: OK, strike that. This has been nagging at me all day. I'm bumping my HC.gov Week Five projection up further to 840,000 for 11/29 - 12/05 (2.88 million cumulatively), or around 3.77 million nationally.
Washington Healthplanfinder Sees 123,000 Select Qualified Health Plans in First Month of Open Enrollment
The Washington Health Benefit Exchange today announced that more than 123,000 residents have selected Qualified Health Plans for 2016 coverage since the launch of the third open enrollment period on Nov. 1. Approximately 112,000 customers renewed plan selections from the previous year, with automatic renewals accounting for more than 84,000 of the 123,209 plans selected through December 1.
All residents who qualify must select a Qualified Health Plan throughwahealthplanfinder.org by December 23 to receive coverage by Jan. 1, 2016. Data collected from the first two open enrollment periods indicate a significant increase in sign-ups as the Dec. 23 deadline approaches. Open enrollment runs through Jan. 31, 2016.
Here's what Democratic Kentucky Governor Steve Beshear's official "Healthier Kentucky" webpage looked like yesterday. Outdated, of course (no updates since the end of the 2015 Open Enrollment Period), but lots of data touting the thousands and thousands of people the Affordable Care Act (aka OBAMACARE, guys) has helped receive healthcare coverage via either private policies or Medicaid expansion:
One more tidbit regarding the debate over how many people are "gaming the system" by abusing the Special Enrollment Periods allowing off-season exchange enrollment: Last spring, after the official Open Enrollment Period (along with the week-long "overtime" period tacked on for people "in line by midnight") ended, the HHS Dept., along with almost all of the state-based exchanges, decided to allow a 6-week "Tax Filing Season" special enrollment period. The idea was that this was the first year that people who hadn't gotten covered with ACA-compliant healthcare coverage the previous year would be hit with a tax penalty ($95 or 1% of their household income), and that as such, it was a bit unfair to dump that on those who truly "had no idea" that there was any sort of financial penalty for not doing so.
As I noted a few weeks ago, Covered California has an annoying policy (they did this last year as well) of not publicizing how many current QHP enrollees have renewed their policies (or switched to a different exchange-based one) until well after the December deadline has passed.
As of Monday, Dec. 7, more than 83,000 Californians had selected plans through Covered California since open enrollment began on Nov. 1.
“Thousands of people are signing up every day for Covered California, and we’re off to a good start to meet our forecasted enrollment of 295,000 to 450,000 new enrollees during this third open-enrollment period,” Lee said.
OK, this one may seem a bit petty, but I'm recovering from a nasty flu at the moment (healthcare!!), so I'm in kind of a petty mood this morning.
Yesterday, Michael Cannon of the CATO Institute (aka the guy behind the infamous King v. Burwell case), who describes himself on Twitter as "Obamacare's Single Most Relentless Antagonist", tweeted out the following:
Wow. | Business Roundup: KP to Acquire Seattle-based Group Health Coop - HealthLeaders Media https://t.co/OzivNilKB9
Kaiser Permanente has announced that it will acquire Seattle-based Group Health Cooperative, a member-governed, nonprofit health system, in a deal worth $1.8 billion.
Sometime this week I'm expecting CMS to release a 2015 Q3 Effectuated QHP report showing how many people were still enrolled in (and paying for) ACA exchange policies as of September 30, 2015.
Out of all of the 2,500+ blog entries I've posted over the past 2+ years here, the one I'm most proud of was "A Response to Avik Roy", from March 25, 2014 (written right in the thick of the crazy, frenzied final week countdown of the first ACA Open Enrollment Period). This was when the site was at its highest traffic level and I was at my highest point of media attention. I was doing nothing but updating the site for about 16 hours per day, interrupted only by eating, sleeping and being interviewed by every outlet under the sun. Needless to say, I was frazzled, exhausted and short-tempered, and in fact I ended up falling victim to a nasty case of shingles as a result immediately after the close of the April 15th "Overtime Period" a couple of weeks later.
This is the first post I've written since Friday, partly because I had my kid's Lego® Robotics League event all day Saturday, partly because I came down with a 24-hour (I hope) flu yesterday.
MICHIGAN WAIVER PUTS CMS IN TOUGH SPOT — The federal waiver Michigan needs to extend its Medicaid expansion has put CMS in a bind — either approve controversial conditions or let the program end next spring. Pro’s Rachana Pradhan writes, “The 2013 Michigan law expanding Medicaid included a provision requiring CMS to approve a waiver with drastically conservative changes by the end of this year. The waiver would require Medicaid enrollees earning above the poverty line to make a choice after four years of Medicaid coverage: Either enroll in a private subsidized plan on HealthCare.gov, or stay in Medicaid and pay up to 7 percent of household income toward health care costs — notably higher than the 5 percent ceiling CMS has held other states to.” If the waiver isn't approved, Medicaid expansion coverage is scheduled to end in April.