New Hampshire has only 5 carriers offering individual market policies, all 5 of which will still be participating in the NH market next year as well. Two of the five (Community Health Options and Minuteman Health) are among the 7 surviving ACA-created Co-Ops.
Even so, NH is proving to be a very tricky state to estimate, because only one of the 5 carrier rate filings includes their actual current rate-impacted enrollment data. As a result, I've had to take my best shot at estimating the market share of the other four. The only way I could think of to do this was to look up the latest NH DOI 2016 QHP Monthly Membership Report. New Hampshire, to their credit, is one of the only states without their own state-based ACA exchange which still actually posts regular reports about how many residents are enrolled in ACA exchange policies. Furthermore, they even break these numbers out by metal level and carrier, making the relative market share easy to calculate.
North Dakota's total individual market was 49,000 people in 2014. Assuming a 25% increase since then, it should be roughly 61,000 today, some portion of which is composed of transitional/grandfathered enrollees. I'm going to assume (based on hard numbers from a few other states) that GF/TR enrollees make up perhaps 10% of the total, or 6,100. They enrolled 21,604 people in exchange plans this year, of whom 20,536 were still enrolled as of the end of March. Last year, Blue Cross Blue Shield of ND held roughly 29,000 enrollees total, with Medica making up another 4,800 or so.
All of the above numbers are important when attempting to estimate the weighted average rate hikes requested by ND carriers, because of the 3 operating on the individual market (BCBS, Medica and Sanford), only one of them, Medica, has provided their actual 2016 enrollment tally (7,329).
Billionaire businessman Donald Trump on Wednesday offered a glimpse into his presidential platform on healthcare, saying he would replace ObamaCare with “something terrific.”
“It’s gotta go,” Trump said of ObamaCare in an interview Wednesday with CNN. “Repeal and replace with something terrific."
Just as I'm wrapping up calculating the weighted average rate hikes requested in all 50 states, New York just became the second state (after Oregon) to release their approved rates:
As of 2014, South Carolina's total individual market was roughly 201,000 people, including grandfathered & transitional enrollees. 205,000 people were enrolled in exchange policies as of the end of March 2016; when you add off-exchange enrollees, it's likely closer to 250K, of which I'd imagine 225K or so are ACA-compliant. The enrollment numbers below therefore should reflect roughly 70% of the ACA-compliant market.
To calculate the Blue Cross Blue Shield average percentage, I had to do a bit of guesswork as to the proportion of their 116,000 enrollees between the 3 different types of plans (BlueEssentials, Multistate and Catastrophic). BlueEssentials is the highest of the three (14.74%), but also likely holds the vast majority (I'd guess 95% or more); usually very few people select Catastrophic plans, and I don't think many go for Multistate either. Therefore, I'm eyeballing the overall average at around 14.4%.
Golf Carts vs. Ford Fiestas: No, "healthcare policy" premiums did NOT go up 49% due to the ACA
Yesterday I posted an entry which noted a story published by Avik Roy over at Forbes about an extensive study by the Manhattan Institute which compared the average insurance policy premiums last year vs. the average premiums this year, after the first ACA open enrollment period. Roy's piece breathlessly claims "Obamacare Increased 2014 Individual-Market Premiums By Average Of 49%"
I wrote a response piece which also included the HHS report about ACA subsidies covering an average of 76% of the premium cost for the Federal marketplace, but I didn't really have time to do a full analysis of the Forbes piece. However, I did note 4 major points which lept out at me right off the bat:
Patients burst into tears at this city’s glistening new charity hospital when they learned they could get Medicaid health insurance.
In Baton Rouge, state officials had to bring in extra workers to process the flood of applications for coverage.
And at the call center for one of Louisiana’s private Medicaid plans, operators recorded their busiest day on record.
The outpouring began in June, when Louisiana became the 31st state to offer expanded Medicaid coverage through the Affordable Care Act, effectively guaranteeing health insurance to its residents for the first time.
Now, as Republican presidential nominee Donald Trump promises to repeal the healthcare law, Louisiana is emerging as a powerful illustration of the huge pent-up demand for health insurance, particularly in red states where elected officials have fought the 2010 law.
Supreme Court grants emergency order to block transgender male student in Virginia from using boys' restroom
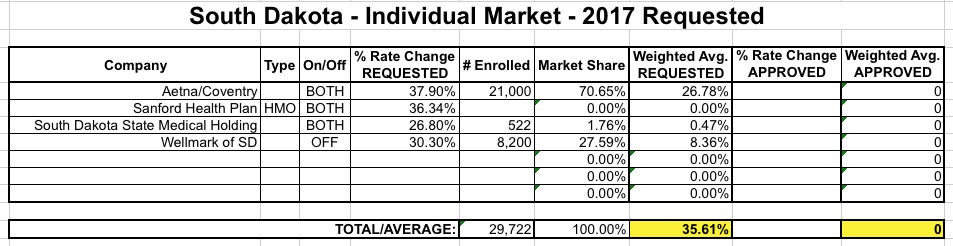
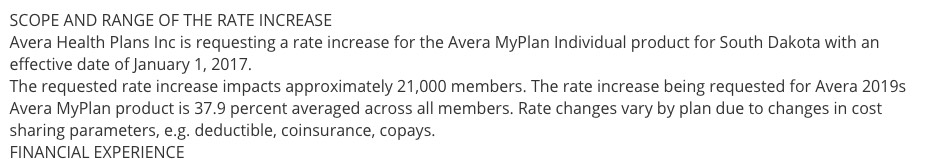
Last month I noted that while South Dakota hadn't posted their ACA-compliant 2017 rate filings yet, they had posted their grandfathered/transitional filings, and decided to take a look at those. While GF/TR plans are down to a pretty nominal number in most states (and about half the states don't have any transitionals at all at this point), SD still has a huge portion of their individual market enrolled in them (over 1/3, from what I can tell).
Only 4 carriers appear to be participating in the ACA-compliant individual market in South Dakota next year: Aetna, Sanfrod, SD State Medical and Welmark. I only have the enrollment numbers for 3 of the 4, but the requested rate hike for the fourth one (Sanford) is pretty close to the average of the other three anyway, so it shouldn't really impact the overall average by much:
As I noted Monday morning, I believe that August 1st was the deadline for every state to submit their 2017 rate filings, meaning that the 14 states missing from my Requested Rate Hike Project are finally available to be plugged into the spreadsheet. I'll also be going back through the other states I've been tracking since as early as April to see which ones require updates due to carriers dropping out, joining in or resubmitting their rate requests.
Wisconsin's total individual market was around 260,000 people in 2014 and is likely up to around 300,000 today (not including grandfathered/transitional enrollees), with about 224,000 enrolled on ACA exchange policies as of March 2016, plus an unknown number off-exchange. That means that the table below is likely missing around 1/3 of the total ACA-compliant market.
As I noted Monday morning, I believe that August 1st was the deadline for every state to submit their 2017 rate filings, meaning that the 14 states missing from my Requested Rate Hike Project are finally available to be plugged into the spreadsheet. I'll also be going back through the other states I've been tracking since as early as April to see which ones require updates due to carriers dropping out, joining in or resubmitting their rate requests.