You may have noticed that I haven't been posting as many blog entries the past week or two. This has been partly due to our 5-day power outage, of course, as well as various other personal odds & ends. The main reason, however, is that I've been driving around the metro Detroit area giving a PowerPoint presentation about the ACA and Trumpcare to various groups. Last night was my 4th or 5th presentation, and while it was kind of sloppy and scattershot the first few times, I'm streamlining and modifying for each new event.
Even so, I'm cramming a lot of information into an hour or so, and several people at each event have asked if I could upload the slideshow to the website for easy download.
Of course, it's impossible to prove that the Trump executive-order/ad-kill combo was the cause of the numbers petering out at the end of the enrollment period...but I have some pretty strong evidence that it did.
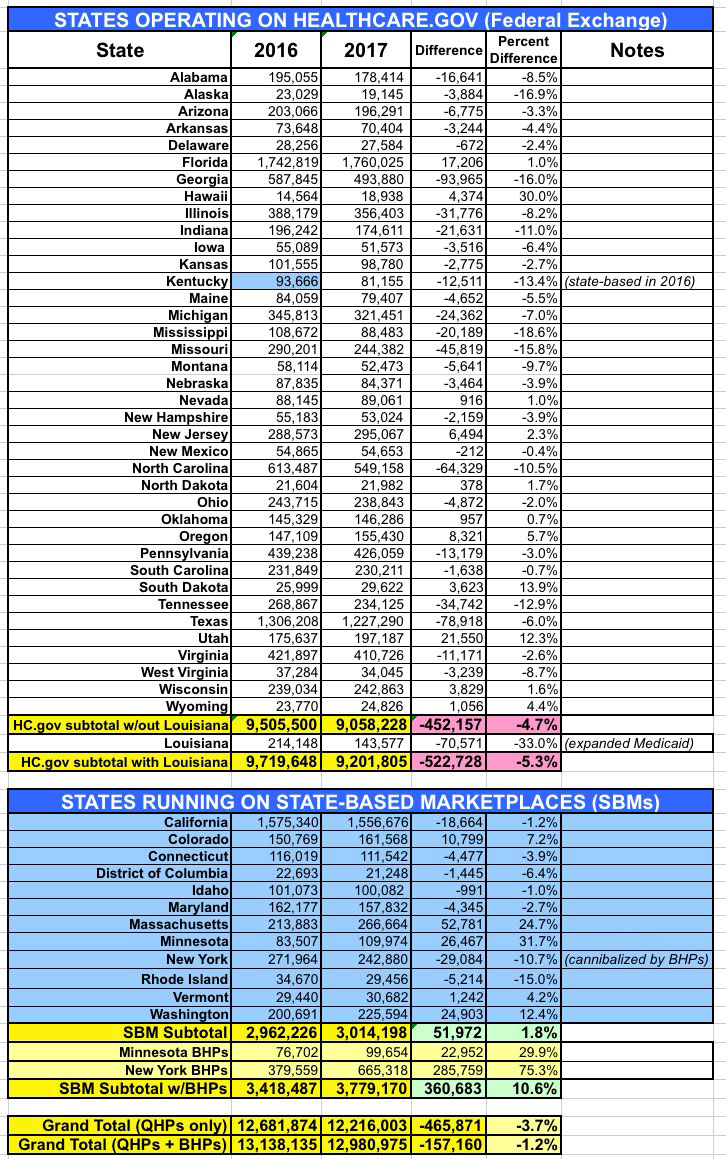
How? Well, remember, the 12 state-based exchanges, which cover around 1/4 of all Qualified Health Plan (QHP) selections nationally, were not hurt by the ads being killed. The executive order might have had some impact, but the actual HC.gov ads being yanked shouldn't have hurt them much since these exchanges have their own, separate branding, marketing budgets and outreach programs.
I therefore decided to compare how the 39 HC.gov states performed relative to the 12 state exchanges...the results are pretty telling.
...UPDATE 3/16/17: I've updated the tables and chart below with the final, official 2017 Open Enrollment Period numbers from CMS.
As I noted earlier today, CMS has released the official 2017 Open Enrollment Period report, along with a whole mess of State, County and Zip Code-level breakouts and related demographic information, including APTC/CSR recipients, Metal Levels, Income Levels and so on.
On the one hand, this will take some time, so please bear with me. It took nearly 2 months to compile this data for all 50 states; it might take another week or so to update them with the latest numbers. Also note that it may only be the 39 states on the federal exchange which get updated, unless some of the state-based exchanges release their own updated reports.
On the other hand, it's important to note that for most counties/congressional districts, the numbers are likely to be fairly close to where they already are. For example, I've already completed Michigan; here's a before/after comparison:
In addition, unless I'm mistaken, most of the actual staff...the career employees at CMS/HHS, many of who've been there through more than one administration, will likely remain, and will do their jobs to the best of their ability, including trying to compile and publish data as accurately as possible.
Yesterday the CBO pretty much torpedoed the Trumpcare bill. Everyone from across the political spectrum now seems to agree that it's a complete disaster, with the exception of Paul Ryan and Tom Price (hell, even an internal Trump White House analysis apparently concluded that even more people would lose coverage than the CBO did...26 million vs. the CBO's 24 million).
However, there's one part of the AHCA which should be kept: The $100 billion that they currently have allocated to throw at the states to stabilize the individual market. As the CBO noted:
After five days, my power still hasn't been restored, and it's no fun typing with freezing fingers on a cold keyboard, but I had to make an exception for this: The CBO has officially scored the Trumpcare bill.
As noted this morning, our power is out and isn't expected to be back up for several days, so my posts will be spotty and brief while we deal with stuff like our kid being out of school, keeping the generator running, etc. However, I just had to post this one.
You've probably already seen this clip, but it's so staggeringly idiotic that I have to repost it here.
Do I even need to explain how gob-smackingly stupid this claim by Paul Ryan is?
...things have been a little hectic around these parts...
I'll try to post an update later this afternoon but, power might not be restored until as late as Sunday, so I have to deal with a whole mess of stuff (including my official day job, of course).
UPDATE 3/13/17: Nope, still out.
UPDATE 3/14/17:
WOO-HOO!!!
Yup, as of 8:12pm Monday evening, we finally got our power back. Yeesh.
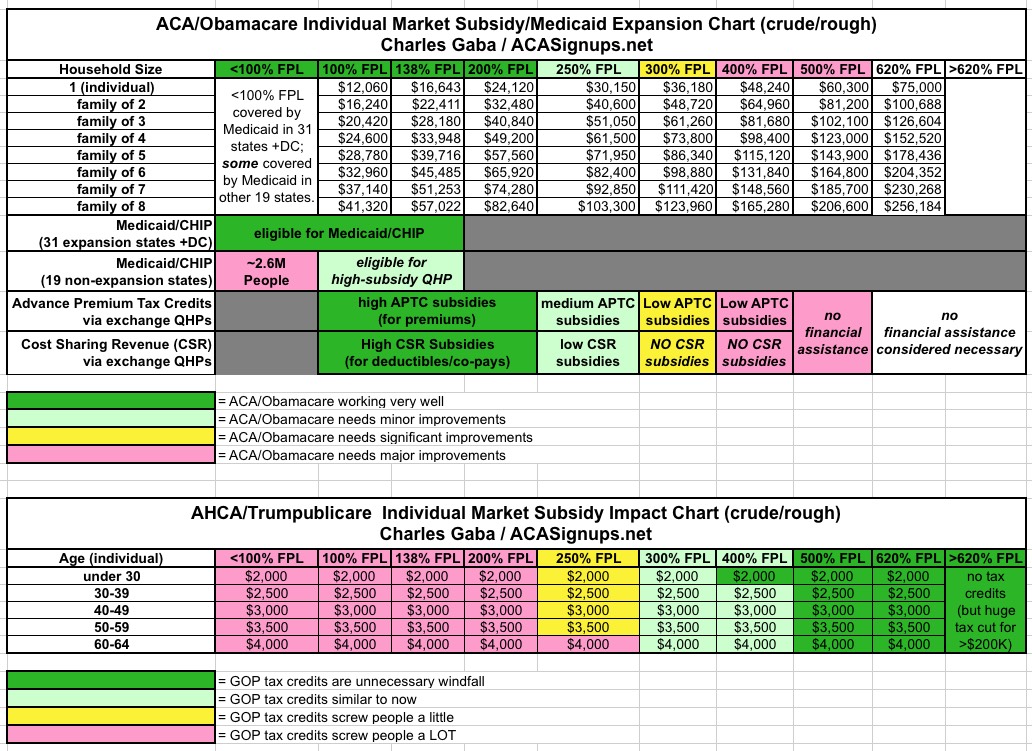
Back in January, being a spreadsheet guy but not being a particularly good graphic artist, I put together a crude table which attempted to give a general idea of which groups of people the Affordable Care Act is, in general, working out for fairly well vs. which groups the ACA isn't working for, by income threshold. A couple of days ago, with details about the GOP's "replacement plan" popping up all over, I posted a similar version of the table which tried to compare the winners/losers between the two plans, and the contrast was remarkable: Nearly a complete reversal.
Last night, with the GOP's plan finally, officially revealed, I made some minor adjustments so that the two tables were more of an apples-to-apples and came up with the following: