

Week 8 & 9 Snapshot Report: 8.76 Million QHPs (w/auto-renewals)
Wed, 01/04/2017 - 3:37pm
Hot on the heels of Covered California's update just moments ago, the HHS Dept. has posted their latest bi-weekly Snapshot report. While the extra 2 weeks of data is obvoiusly important, the key number I've been anxiously awaiting is the auto-renewal number, which is finally included in today's report:
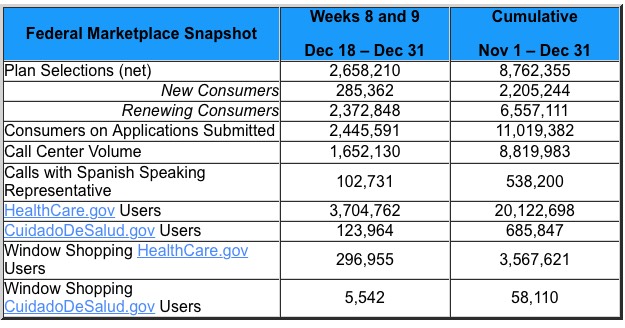
Biweekly Enrollment Snapshot • WEEKS 8 AND 9, DEC 18 – DEC 31, 2016
8.8 million Americans have signed up for coverage through HealthCare.gov since Open Enrollment began on November 1st. This compares to about 8.6 million plan selections last year at this time, demonstrating Americans’ strong and growing demand for affordable, quality coverage. Total plan selections as of December 31st, which include auto reenrollments, consist of 2.2 million new consumers and 6.6 million returning consumers. Among returning consumers, two thirds, or 4.4 million, actively selected a plan, an increase from last year’s already high levels of consumer engagement.
“With 8.8 million Americans signed up for coverage through HealthCare.gov, more than last year at this time, it is clear that Americans want and need this vital coverage,” said U.S. Department of Health and Human Services Secretary Sylvia M. Burwell. “As we enter the New Year, Americans who are still uninsured should sign up by January 15th to have coverage starting February 1.”
Today’s report covers the period from December 18 through December 31, 2016. This snapshot does not include plan selections from the 12 State-Based Marketplaces that use their own enrollment platforms. Those numbers will be included in the upcoming Mid-Open Enrollment report.
As in past years, enrollment weeks are measured Sunday through Saturday. Since this year Open Enrollment began on a Tuesday, the totals reported in this snapshot reflect two fewer days than last year’s Week 9 snapshot, yet still enrollment exceeds last year’s total.
The hard total is 8,762,255 QHP selections as of 12/31/16 across the 39 states covered by the federal exchange (HealthCare.Gov).
It's true that this year's "Week 9" report is 2 days shorter than last year...but seeing how one of the 2 missing days this year was New Year's Day (which was also a Sunday), I suspect only a nominal number of enrollees are actually "missing".
Last year's Week 9 report also didn't bother breaking out new vs. renewing enrollees since the auto-renewals had already been lumped in during Week 8, but I can figure that out by combining the Week 8 & 9 reports: As of 12/26/16, HC.gov had roughly 2,472,231 new enrollees (29%), plus another 83,297 during Week 9, for a total of ~2,555,528 new people signing up.
The breakout, judging by the hard numbers and the wording above, is:
- 8,762,255 total QHP selections (vs. 8,608,232 last year...154K more people total)
- 2,205,244 new enrollees (vs. ~2,555,528 last year...350K fewer new additions)
- 6,557,111 renewing enrollees (vs. 6,052,704 last year...504K more people renewing their policies, actively or passively)
UPDATE: Whoops...as Nick H and Larwit1512 remind me in the comments below, this still isn't an apples-to-apples comparison, because Kentucky moved onto the federal exchange this year; I have to subtract their 70,542 enrollees from the HC.gov tally to match them up fairly.
I don't know the new/renewal breakout for Kentucky specifically, but across the other 38 states, the number to use this year is 8,691,713, or just 83,481 more than this point last year. That's a mere 1% higher.
They didn't provide an exact breakout of how many of those renewing did so actively vs. auto-renewing, but the wording above suggests that it was roughly 4.4 million active renewals (4.3 million through 12/19, plus another 100K or so over the next 12 days), which leaves 2,157,111 auto-renewals.
So, how does this compare with my expectations/projections? Well, that depends on your POV. I was originally expecting total HC.gov enrollments (including active renewals, auto-renewals and new additions to be around 9.5 million by New Year's Eve; the actual number is nearly 740,000 lower than that.
On the other hand, the drop-off in new enrollments is only down 13.7% year over year. This is an improvement over the 14.4% drop as of 12/19, which itself was an improvement over the 16% drop as of 12/10, which was an improvement over the 22% drop as of 11/12. In other words, new enrollees started off at a much slower pace but are gradually making up the difference as the enrollment period moves on.
In addition, while some state exchanges such as Rhode Island are coming in short of my expectations, others, like Massachusetts, are well ahead of the game.
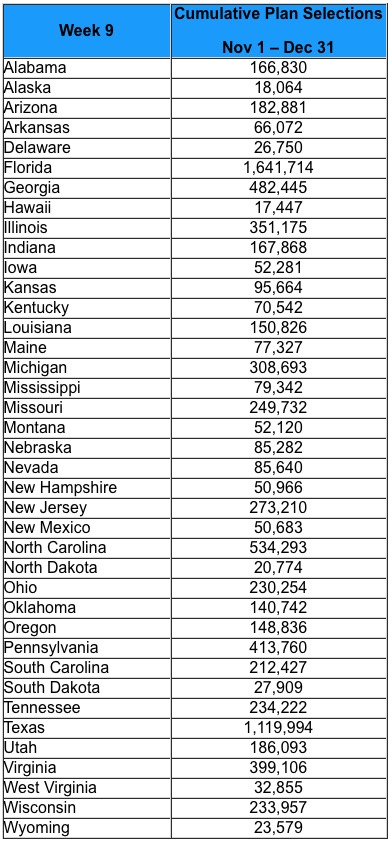
I'll post a revised graph/final projection in a separate entry. Meanwhile, here's the state-by-state numbers:
Advertisement
