

SHOW YOUR WORK: Healthcare Coverage Breakout for the Entire U.S. Population in 1 Chart
Mon, 03/28/2016 - 12:53pm
UPDATE: I just asked Larry Levitt, Senior Vice President for Special Initiatives at the Kaiser Family Foundation, to take a look at my analysis to see if anything below seems to be significantly off-base in terms of my logic, analysis, estimates and so forth. I was particularly concerned because I've modified/extrapolated from a lot of data which was originally reported on by KFF. His response:
@charles_gaba Obviously some of the estimates are approximations, but I don't see any glaring problems.
— Larry Levitt (@larry_levitt) March 29, 2016
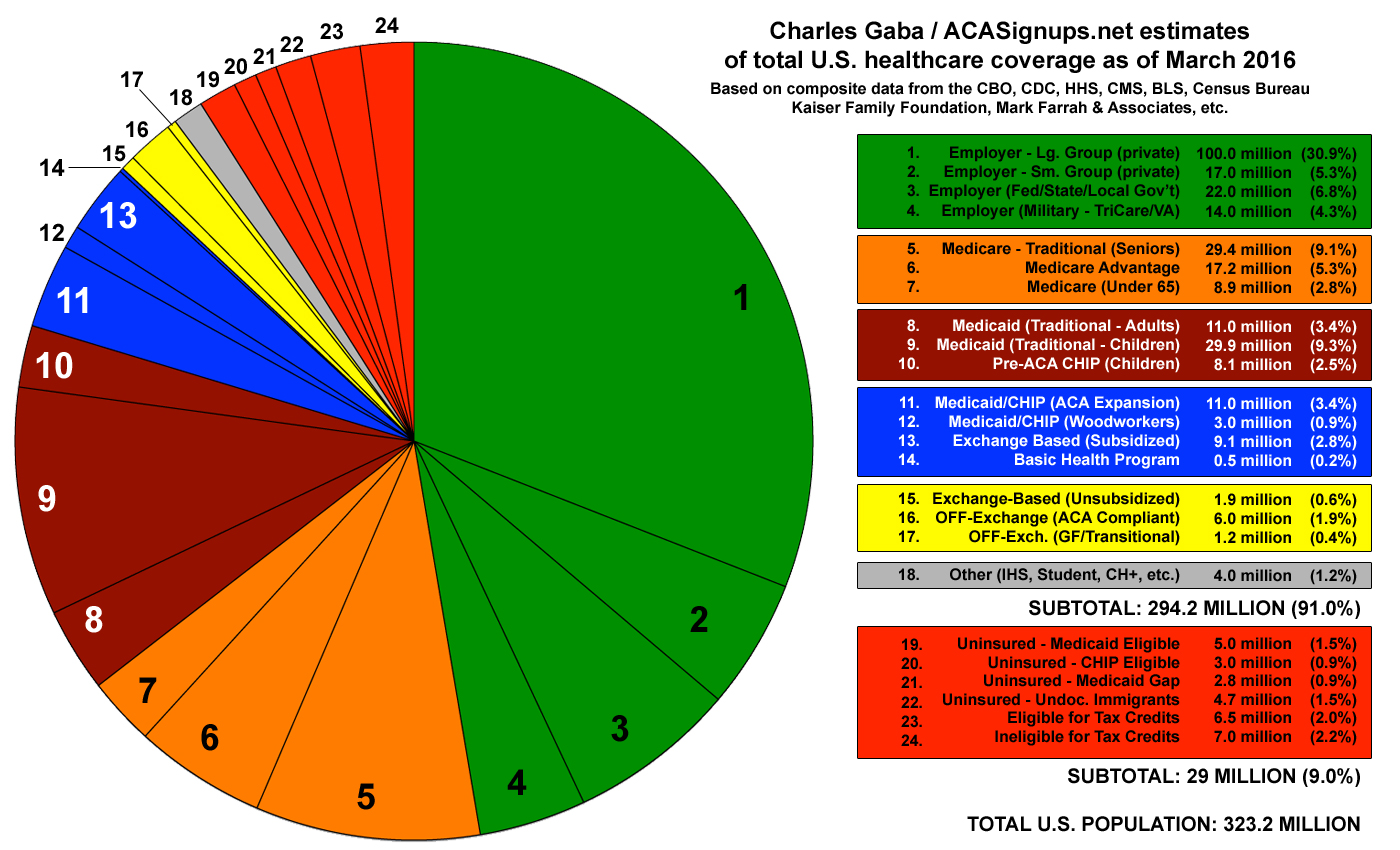
Over the past few days, I've been fine-tuning an ambitious attempt to boil down the entire U.S. population into a single pie chart broken out by type of healthcare coverage (or lack thereof).
While I've spent an absurd amount of time on this, I originally wasn't planning on linking to specific data sources because a) this is supposed to be more of a general overview, with many "composite" numbers blended from various sources and b) frankly, it's taken up too much time already.
However, by popular request, I've decided to go ahead and explain both my sources and reasoning. In some cases I have hard data to work with; in others I'm splitting the difference between two or more reliable sources; and in some cases I'm extrapolating my best estimates from the data on hand.
IMPORTANT: Please note that 1) I've made a few additional tweaks even beyond earlier ones (most notably, I decided to break out the "woodworker" category after all), and 2) barring any major errors being called to my attention, this is the final version (at least for the next few months; it's just eaten up way too much time already).
TOTAL U.S. POPULATION: 323.2 million
As of this moment, the entire U.S. population is...
- 318.8 million, according to Google.
- 323.2 million, according to Wikipedia.
- 323.5 million, according to WorldOMeters
- 323.2 million, according to the U.S. Census Bureau
...which is up from 321.4 million in July 2015 and 318.8 million in July 2014 (again, according to the Census Bureau). Needless to say, I'm gonna go with the U.S. Census Bureau data here: 323.2 million.
UNINSURED POPULATION: 29.0 million (The RED Section)
Most of this is based on estimates from the Kaiser Family Foundation in their "New Estimates of Eligibility for ACA Coverage Among the Uninsured". In the January 22, 2016 update to this report, they estimate the total non-elderly uninsured population of the U.S. as being around 32.3 million. When you include seniors 65 and older, this increases slightly. According to the HHS Dept., in 2012, around 1.7% of seniors were uninsured even with Medicare, Medicaid, the VA and so forth, which would've been around 700,000 people (out of appx. 41 million seniors total in 2012, according to the Census Bureau). Assuming this stayed roughly even over the past 4 years, Kaiser's total would be an even 33 million uninsured.
HOWEVER, the actual methodology of the Kaiser report says:
This analysis uses data from the 2015 Current Population Survey (CPS) Annual Social and Economic Supplement (ASEC). The CPS ASEC provides socioeconomic and demographic information for the United Sates population and specific subpopulations. Importantly, the CPS ASEC provides detailed data on families and households, which we use to determine income for ACA eligibility purposes.
The CPS asks respondents about coverage at the time of the interview (for the 2015 CPS, February, March, or April 2015) as well as throughout the preceding calendar year. People who report any type of coverage throughout the preceding calendar year are counted as “insured.” Thus, the calendar year measure of the uninsured population captures people who lacked coverage for the entirety of 2014 (and thus were uninsured at the start of 2015). We use this measure of insurance coverage, rather than the measure of coverage at the time of interview, because the latter lacks detail about coverage type that is used in our model. Based on other survey data, as well as administrative data on ACA enrollment, it is likely that a small number of people included in this analysis gained coverage in 2015.
In addition, the National Health Interview Survey from the CDC, which I believe is considered the "gold standard" for this data, states that:
The number of uninsured persons has declined in the past 2 years. In the first 9 months of 2015, 28.8 million persons of all ages (9.1%) were uninsured at the time of interview—7.2 million fewer persons than in 2014 and 16.0 million fewer than in 2013.
Note that the NHIS only runs through September 2015...which means it doesn't include any data from the most recent open enrollment period, nor does it include the implementation (or continuing progress) of additional Medicaid expansion efforts in states like Alaska, Montana, Indiana and Pennsylvania since last fall. Finally, the economy has continued to improve over the past 6 months, so there should have been some further improvement via employer-sponsored coverage, and so on. In other words, the current uninsured number is likely at the lower end of the Kaiser (33.0 million) / NHIS (28.8 million) range.
Finally, the just-released CBO budget projection report says that they expect the full 2016 calendar year to average just 27 million uninsured for the under-65 population. Even throwing in 700K seniors, that's still just 27.7 million for the full current year.
There are various other respected surveys from outlets like Gallup, the Commonwealth Fund, the Urban Institute and the RAND Corporation, but I'm pretty comfortable using a flat 29.0 million here.
As for how to slice up that 29 million, that's where I'm going back to rely on the Kaiser report. While their total number was higher, percentage-wise they broke it out as:
- 18% Adults eligible for Medicaid (either traditional or via expansion) (5.8 million based on 32.2 million total)
- 10% Children eligible for Medicaid/CHIP (3.2 million)
- 22% Eligible for subsidized ACA exchange policies (7.0 million)
- 9% Caught in the Medicaid Gap (2.9 million)
- 15% Undocumented Immigrants (4.8 million)
- 27% Not eligible for subsidized ACA exchange policies (either income too high or standing ESI offer) (8.6 million)
I could have simply lopped each of these numbers down by about 12%, but the number caught in the Medicaid Gap is determined by individual state policy, not by time simply passing. Kaiser's 2.9 million figure already accounts for Louisiana expanding Medicaid, for instance, even though they haven't actually implemented that policy yet. On the other hand, some of those folks may have moved to an expansion state, gained a job with benefits and so on, so there's likely to have been some shifting around. Here's how I revised these totals:
- Adults Medicaid Eligible: 5.0 million
- Children Medicaid/CHIP Eligible: 3.0 million
- Medicaid Gap: 2.8 million
- Undocumented Immigrants: 4.7 million
- Eligible for Subsidized Exchange policies: 6.5 million
- Ineligible for Subsidized Exchange policies: 7.0 million
OK, that leaves us with around 294 million people who are covered by either employer-sponsored insurance, Medicare, Medicaid, CHIP, ACA exchange policies, off-exchange individual policies or some other program:
EXPANDED COVERAGE SPECIFICALLY DUE TO THE ACA: 23.6 million* (The Blue Section)
I debated greatly whether to bundle together Subsidized/Unsubsidized exchange policies, since all of them are technically enrolled in through the ACA exchanges specifically. However, my gut tells me that most of those who enrolled in unsubsidized polcies via the exchange (ie, paying full price) would have, absent the ACA, simply enrolled directly through their insurance carrier anyway (as millions of others are still doing).
Since the primary point of the color-coding in this chart is to group the expanded coverage due specifically to the ACA itself, I've instead moved unsubsidized exchange enrollments in with off-exchange policies. For similar reasons, I'm grouping "ACA Medicaid expansion" in with subsidized exchange policies (and the Basic Health Program) instead of with Medicaid/CHIP where you'd normally expect.
With that in mind:
- Subsidized Exchange Policies: 9.1 million
According to the official APTC report, 10.47 million exchange enrollees were eligible for APTC subsidies (federal tax credits). However, experience over the 2014 and 2015 enrollment periods has made it pretty clear that around 10-12% of exchange enrollees never pay their first premium and are never actually enrolled in effectuated coverage or are kicked off due to a lack of legal residency verification. Combine this with normal attrition as people get jobs with ESI, age into Medicare and so forth, and the effectuated exchange number is likely down around 13% of the total QHP selections by the end of the first quarter...or around 9.1 million people.
- Medicaid/CHIP Expansion: 11.0 million
- Medicaid/CHIP Woodworkers: 3.0 million
The official November 2015 CMS Medicaid/CHIP report shows that the total number is up about 14.1 million over what it was pre-expansion. However, as I've noted many, many times before, around 25-30% of these are actually "woodworkers"...people who were already eligible for Medicaid/CHIP pre-expansion but either didn't realize it, didn't know the process for enrolling or were too embarrassed to do so...yet were encouraged to do so thanks to the ACA's outreach/education efforts. The recently-released CBO report puts the official "expansion only" number at 11 million, which sounds about right to me, leaving about 3 million Woodworkers.
- ACA Basic Health Program (BHP): 500K
This one's fairly easy: One of the lesser-known provisions of the Affordable Care Act allows for states to (voluntarily) implement a "Basic Health Program", which is sort of a "Medicaid on Steroids" (or, alternately, a potential blueprint for a Public Option). Only two states have done so to date: Minnesota (which actually already had their program in place pre-ACA called "MinnesotaCare", but retooled it and had it approved for BHP purposes) and New York, which just launched their BHP program this year. New York enrolled around 380,000, while Minnesota has a total MinnesotaCare enrollment of around 100,000 (although, confusingly, only about 40,000 of these appear to have been run thorugh their ACA exchange website). Add them up and that's around 480,000 in BHPs. I debated whether Minnesota's program should be considered "ACA specific", but decided that the program's membership has definitely increased substantially since the exchanges were launched and I believe the HHS Dept. is picking up the bulk of the cost now, so it counts. Rounding up, that's 500K BHPs.
*It's important not to confuse this figure (23.6 million) with the net increase in covered lives under the ACA to date (appx. 20 million). Bear in mind that only perhaps 5 million of the 9.1 million subsidized exchange enrollees are newly covered via the ACA; the rest switched over from some form of existing coverage. Similarly, not all 14 million of the Medicaid/CHIP enrollees listed here are newly covered, although the vast bulk are (perhaps 12 million). The remaining 3 million or so "newly covered" are mostly part of the "young adults on their parent's plans" (which, in turn, are mostly part of the large Employer Sponsored section), along with smaller numbers among other sections.
OK, that's 10 sections down, 14 left to go!
UNSUBSIDIZED INDIVIDUAL MARKET: 9.1 million (the Yellow Section)
- Unsubsidized Exchange Policies: 1.9 million
Again looking at the OE3 APTC report, out of 12.67 million QHP selections, 10.47 million are APTC-eligible...leaving 2.2 million which aren't. Again assuming that roughly 13% of these folks have dropped off as of this week, that's appx. 1.9 million still effectuated. I suspect that subsidized enrollees are more likely to drop their policies than unsubsidized, but that's getting even more nit-picky than I like.
- Off-Exchange Individual Market (ACA Compliant): 6.0 million
As I've noted repeatedly, the off-exchange market is difficult to track since most states don't require private carriers to report enrollment numbers on a regular basis (if at all). However, I've long estimated that this number is likely around 7-8 million people, and the CBO report recently gave their estimate at around 9 million. However, it's important to remember that this includes grandfathered and transitional policies (see below). Subtract those and assume some amount of attrition (perhaps 10% instead of 13%) and you're down to around 6 million people enrolled in off-exchange policies which are compliant with ACA requirements...although this is a strengthening of the policy due to the ACA, not actual coverage expansion, which is why these aren't listed in the blue section. - NON-ACA Compliant Grandfathered/Transitional Policies: 1.2 million
This is kind of a mystery number; the best I've been able to do is to extrapolate out from Florida data, which gives a very shakey 1.2 million estimate. However, this fits well within my "7-8 million" range anyway, so I'll go with that for the moment. Note that this entire section should disappear entirely within another year or two.
MEDICARE: 55.5 million (the Orange Section) (includes around 9.2 million "dual eligibles" enrolled in both Medicare & Medicaid)
The total number comes from the Kaiser Family Foundation's 2015 Total Number of Medicare Beneficiaries report. I'm sure it's a bit higher than this by now, but this is the most solid, recent figure I have at the moment.
- Medicare enrollees under 65: 8.9 million
Again, according to the Kaiser Family Foundation, about 16% of Medicare recipients are disabled individuals under 65 years old.
- Medicare Advantage: 17.2 million
Again, Kaiser is the name to beat here: 31% of all Medicare recipients are in Medicare Advantage plans. I'm not sure if these are split between the Over 65 and Under 65 crowd, but I'm just gonna carve them out of the Over 65 chunk, which leaves...
- (Traditional) Medicare enrollees 65 and older: 29.4 million
TRADITIONAL MEDICAID/CHIP: 49.0 million (The Brown Section) (not including Expansion & Woodworkers)
TOTAL Medicaid/CHIP enrollment was 71.8 million people as of December. It's probably a bit higher now, but that's the most recent enrollment data.
Of that, as noted above, about 9.2 million are "dual eligibles" who I'm lopping off as they're already listed under the Medicare section. That leaves about 62.6 million total.
Of those, I've already accounted for 14 million via ACA expansion and Woodworkers, leaving about 48.6 million.
- CHIP (Non-ACA): 8.1 million
Of those, around 8.1 million children were enrolled in the CHIP program (formerly known as S-CHIP) as of 2014 according to CMS. The "ever enrolled" wording had me confused at first (I thought it might be cumulative since the program was started in 1997, which wouldn't make much sense), but the yearly comparison numbers clearly show that it's referring to children who were enrolled for any period of that calendar year, which is fine.
- Children's Medicaid (Traditional): 29.9 million
The December CMS Medicaid report also specifically states that across the 46 states which broke out the categories, "children enrolled in the Medicaid program and individuals enrolled in CHIP make up nearly 53 percent of total Medicaid and CHIP program enrollment." Out of 71.8 million people total, that's about 38.0 million. If 8.1 million of those are enrolled in CHIP itself, that leaves 29.9 million children enrolled in Medicaid proper. Subtract those from the total, and you're left with... - Adult Medicaid (Traditional): 11.0 million
Yes, that's right: As far as I can tell, there are nearly 3 times as many children enrolled in Medicaid itself as adults (and 3.7x as many as are enrolled in CHIP). This really surprised me, as I honestly thought that "Children's Medicaid" and "CHIP" were just two different names for the same program; it turns out that they aren't the same at all, although the distinction might only be one of where the funding comes from. At the same time, this actually makes sense when you look at this absurd table showing all the different "eligibility threshold" categories for different residents of each state, especially the non-expansion ones. For instance, Alabama enrolls children in Medicaid if their families make up to 141% of the Federal Poverty Line...but their parents only qualify up to an absurd 13% FPL, and adults without kids are SOL since this is a non-expansion state.
I think the way it works is this (again, using Alabama as an example): Medicaid covers children in households from 0 - 141% FPL; CHIP covers the kids in households from 142% - 312%. It varies by state, of course.
OK, what does that leave? Well, I believe we're down to "Other" and the Big One: Employer Sponsored Insurance. Let's take a look at the tally so far:
- Employer (total): 153 million
- Medicare (total): 55.5 million (includes 9.2 million dual-enrolled in both Medicare & Medicaid)
- Medicaid/CHIP (non-ACA): 48.1 million
- ACA-Specific: 23.6 million (Med. expan., woodwork, sub. QHPs, BHPs)
- Non-ACA Individual Market: 9.1 million
- Other: 4.0 million
- UNINSURED: 29.0 million
OTHER: Around 4.0 million (The Grey Section)
- "Other" is a catch-all category covering anything which didn't seem to belong anywhere else:
- The Indian Health Service, which (according to Wikipedia) "currently provides health services to approximately 1.8 million of the 3.3 million American Indians and Alaska Natives"
- An unknown portion of the 2.3 million people incarcerated in prison/jail nationally** (some prisoners have been/are being transferred over to Medicaid via the ACA, but I don't know the numbers...perhaps half of them?)
- An unknown number of college students enrolled in student health plans nationally
- Around 215,000 children enrolled in New York's unique "Child Health Plus" (CH+) program (which has no connection with CHIP even though they sound the same)
- Other various & sundry (permanent residents with healthcare coverage via other nations, etc).
**I should also note that it's even possible that a portion of the 2.3 million incarcerated population is actually lumped in under "government employee" coverage. What I mean is this: It's possible that some states include all healthcare costs for their correctional departments under a single line item in the state budget--i.e., "healthcare" including coverage for guards, administration and the prison population. I don't know if this is the case, but it might account for some of that group.
Subtract all of that and you're left with the largest major section:
EMPLOYER SPONSORED INSURANCE: 153 million (Green Section)
I'm well aware that this number seems a bit low. Out of 323 million total, that's only 47.4% of the population, compared with the following estimates:
- Kaiser Family Foundation, 2014: 49% (158.4 million equivalent today)
- Congressional Budget Office, March 2015: 154 million full-year average for 2015; 156 million for 2016
- Congressional Budget Office, March 2016: 155 million full-year average for 2016
However...what can I say? I'm doing a lot of rounding off and estimating here, and I'm pretty sure that the Medicare/Medicaid "Dual Eligible" category isn't the only area where some of them overlap by a few hundred thousand or so. There's some amount of uncertainty in all of the categories, so if I'm gonna trim one category down a bit to cover the difference, it might as well be the one where the difference is the least visible.
With that in mind, while it's been trending downwards over the years (even pre-ACA, I believe) Employer-Sponsored Insurance still covers nearly half of the country's population, which is one of the reasons why messing with it can be so difficult to do. I have it broken out into 4 chunks:
- Military (Tricare/VA): 14.0 million
The last time I tried this last summer, Julie Rovner of Kaiser Health News helped me cobble together rough numbers: Around 1.5 million active duty military personnel and around 12.5 million non-active personnel.
- Government Employees/Families (Federal, State & Local): Around 22.0 million
According to a report from the Bureau of Labor Statistics, there are a total of roughly 22 million federal, state and local employees. I don't think this includes the military, but if someone can clarify this I'll edit the chart accordingly. I recognize that not all of these employees may have coverage due to being part-time, union concessions and so forth, but again, until someone can provide better data, I'll stick with it.
- Private Sector: Small Group: Around 17.0 million
This number comes from Mark Farrah and Associates, a respected healthcare industry/insurance analytical firm. They had the sm. group market at around 16.7 million in 2013. I assume it's grown slightly since then, but not necessarily that much given the anemic numbers to date from the ACA's SHOP program.
- Private Sector: Large Group: Around 100 million
Simple math: 153 million, minus 14 million, minus 22 million, minus 17 million leaves a nice even 100 million Americans enrolled in private, large group policies nationally.
So, there you have it. Am I way off on some of the above? Possibly. Am I off by a little on some? Definitely. Have I shown my work and my sources? Yes. Am I in the right ballpark overall? I'm pretty sure I am.
Put all of it together, and here's the FINAL version (yeah, I said that this morning but this time I mean it!):
(Click image for a high-res version)
In addition, it’s important to remember that while the ACA is only directly connected to those 4 blue sections (yes, there's 4 of them, not 3...don't forget #14, BHPs), it also impacts large chunks of the rest of the pie, since the pre-existing condition, free preventative care & some other provisions covers all private policies (including employer-sponsored in most cases).
UPDATE: I'm not going to revise the actual chart anymore for awhile (it takes time to make even minor tweaks), but I am going to start listing additional suggestions for future reference here:
- Healthcare "data wizard" Mike K thinks that Section 2 (Small Group Employer) should be larger relative to Large Group, pointing out that:
"1. SHOP is anemic because it's a burdensome system and does not reflect the size/growth of the market;
2. Although the national rollout was delayed, NY changed SG def from 50 to 100 EEs on 1/1/16 so there's a large increase"
UPDATE: Jamey Harvey, tech lead for the DC exchange, suggested breaking out exchange-based vs. off-exchange employer-based coverage. This is a good idea, but as far as I can tell, that really just refers to SHOP enrollees, which I'm fairly certain are barely a rounding error here--perhaps 200,000 people nationally at most (for comparison, the BHP program (#14) is around 500,000 people, and that's barely visible in the chart above). I'll be posting about SHOP soon and will consider adding one more tiny sliver for that.
Advertisement
