The Department of Insurance receives preliminary health plan information for the following year from insurance carriers by June 1 and reviews the proposed plan documents and rates for compliance with Idaho and federal regulations.The Department of Insurance does not have the authority to set or establish insurance rates, but it does have the authority to deem rate increases submitted by insurance companies as reasonable or unreasonable. After the review and negotiation process, the carriers submit their final rate increase information. The public is invited to provide comments on the rate changes. Please send any comments to Idaho Department of Insurance.
Back in July, I warned that my original projections from earlier in the year of how much net ACA enrollee premiums will increase starting in January 2026 in all 50 states +DC if the enhanced premium tax credits are allowed to expire would have to be revised & updated due to two major changes which had taken place since then:
OK, this is a bit embarrassing, but I just realized that the last time I wrote anything significant about about Illinois joining 20 other states in moving off of the federally-facilitated ACA marketplace (HealthCare.Gov) onto their own fully state-based platform (Get Covered Illinois) was nearly 2 1/2 years ago, when the state legislature passed the bill and Gov. Pritzker signed it into law!
For obvious reasons it feels a little weird to be writing about it at this particular moment in time, but the fact remains that yes, Illinois will be making the move starting November 1st, 2025. Here's a formal press release from August:
Get Covered Illinois Transitions to a State-Based Marketplace this November
Company’s HR Manager Really Pushing Infinite-Deductible Health Care Plan
During a meeting with new hires Wednesday to discuss employee benefits, Radian Analytics human resources manager Ellen Schultz is said to have strongly pushed the company’s infinite-deductible health care option.
According to sources in attendance, Schultz described the low-premium, infinite-deductible plan as the simplest and most convenient choice available to employees, and said it works the same whether plan members need to visit their primary care physician, fill a prescription, or be admitted to a hospital, allowing them in each case to pay 100 percent of the incurred medical expenses.
It's been awhile since I've done one of these, but let's go through his entire post point by point, shall we?
Ronald Reagan once quipped that “nothing lasts longer than a temporary government program.”
He could have been talking about the effort to extend — for a second time — former President Joe Biden’s Affordable Care Act-enhanced tax credits, a set of extremely generous federal health insurance subsidies intended to help Americans get through the COVID-19 crisis.
Stop right there: The "extremely generous" subsidies which he refers to are actually far less generous for higher-income enrollees than employer-sponsored insurance tax exclusions.
The District of Columbia has around ~15,000 residents enrolled in ACA exchange plans. Unlike most states where nearly all ACA exchange enrollees are subsidized, in DC only around 28% are due to the District having an unusually high income eligibility threshold for Medicaid (210%).
DC also has a unique requirement that ACA individual market plans can only be sold on their ACA exchange; I'm assuming perhaps 1,000 off-exchange enrollees regardless but officially I believe this should be pretty much zilch. With net attrition since January, however, it looks like the grand total is actually a bit below 14,000 District-wide.
This page contains proposed health plan rate information for the District of Columbia’s health insurance marketplace, DC Health Link, for plan year 2026.
The District of Columbia Department of Insurance, Securities and Banking (DISB) received 188 proposed health insurance plan rates for review from CareFirst BlueCross BlueShield, Kaiser Permanente and United Healthcare in advance of open enrollment for plan year 2026 on DC Health Link, the District of Columbia’s health insurance marketplace.
The three insurance companies filed proposed rates for individuals, families and small businesses for the 2026 plan year. Overall, 188 plans were filed, compared to 198 last year. The number of small group plans decreased from 171 to 161, and the number of individual plans remained at 27.
I joined Brad Friedman of The Brad Blog yesterday to discuss the ongoing battle over saving democracy & the impending expiration of the enhanced ACA premium tax credits (I show up starting about halfway into the hour-long episode).
You can listen to our discussion via various outlets:
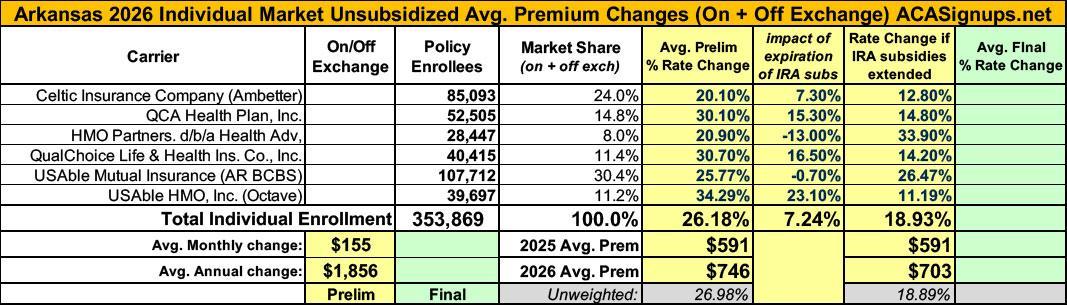
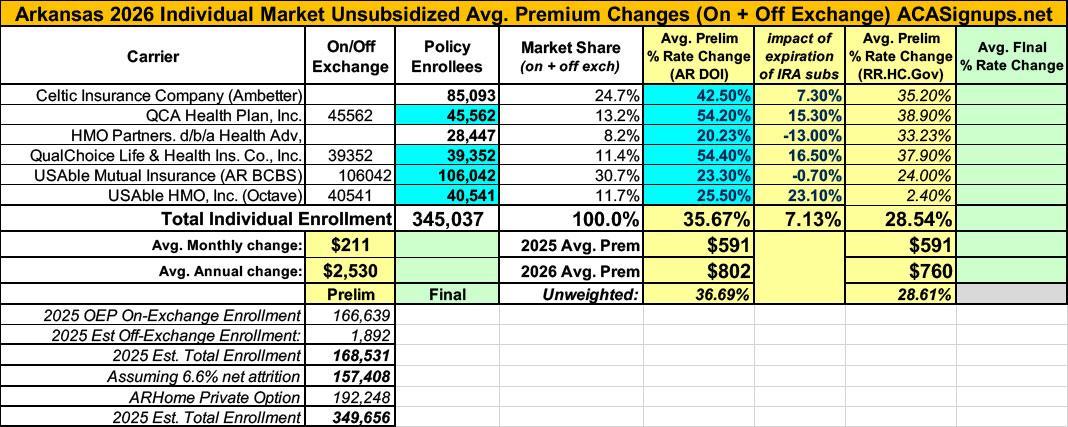
Back in July I posted my analysis of the preliminary 2026 rate filings by the 6 Arkansas insurance carriers participating in the individual market. At the time, they looked like this:
...This letter is formal notice that Aetna Health Inc. (“AHI”) intends to exit from the Individual health insurance market in Virginia effective January 1, 2026. Subject to the Department’s review, we will mail the 180-day notices of discontinuance to covered individuals.
As of May 2025, our records show that AHI has 9,810 subscribers and 13,721 total members in Virginia.