

114% is the new 75%: As I warned, net ACA rate hikes will increase EVEN MORE if the improved tax credits expire
Tue, 09/30/2025 - 2:05pm
(with apologies to “Weird Al” Yankovic)
Back in July, I warned that my original projections from earlier in the year of how much net ACA enrollee premiums will increase starting in January 2026 in all 50 states +DC if the enhanced premium tax credits are allowed to expire would have to be revised & updated due to two major changes which had taken place since then:
- First, my original analysis assumed a 4.3% average full-price premium increase in every state. At the time none of the carriers had published even preliminary filings for 2026, so all I had to go with was the Congressional Budget Office's projection that the subsidies expiring would bump up avg. gross premiums by 4.3% by itself.
That 4.3% didn't include any other "normal" factors such as general inflation, increased utilization of medical services, the added cost of covering new prescription medications like GLP-1 drugs (WeGovy, Ozempic, etc) and so on.
It also couldn't account for the impact of the Trump Regime's tariffs on foreign-produced medical equipment and prescription drugs, which hadn't been imposed yet.
The actual average gross rate hike is expected to be over 23% nationally (this could potentially drop down to perhaps 21-22% once the remaining state regulators have finalized their rate decisions), though it ranges from flat in Alaska to as high as nearly 37% in Mississippi.
- Second, my original analysis also didn't account for administrative policy changes...primarily the so-called "Marketplace Integrity & Affordability Rule" put into place by the Centers for Medicare & Medicaid Services (CMS) in June.
There's a lot of wonky stuff included in the CMS rule, some of which impacts 2026 rate changes. Some of those provisions have been stayed by a federal judge, but others are still going through...including, unfortunately, one of the most impactful ones in terms of net premiums for around 22 million ACA enrollees.
As I explained back in July, this is about the Premium Adjustment Percentage Index and the Applicable Percentage Table:
It gets wonky, but this is what determines the formula for how generous ACA premium tax credits are for those eligible for them each year.
In 2025, with the IRA subsidies in place, here's what the Applicable Percentage Table looks like:
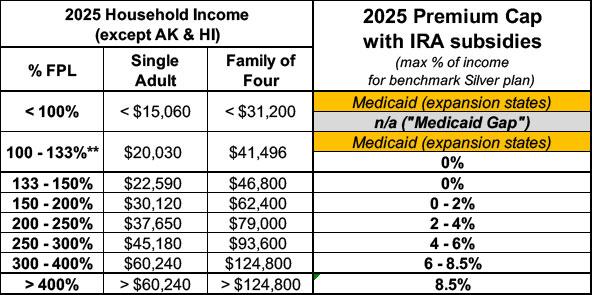
In other words, if you're a single adult who earns $30,000/year (just under 200% FPL), you pay no more than 2% of your income for the benchmark Silver plan. That's $600/year, or no more than $50/month. If you earn $50,000//year (332% FPL), the benchmark plan would cost no more than 6.8% of your income, or around $283/month.
If the IRA subsidies expire, however, there are three things which change: First, that last row for enrollees earning more than 400% FPL goes away--they have to go back to paying full price. This is called the "Subsidy Cliff" and I've talked about it many times before.
The second change is that the other percentages revert back to the original, pre-2021 levels, which are far less generous. I've also talked about that before, and that's what my existing analyses are based on.

My original analyses were based on the assuption that the formula would simply revert back to what it the Biden-era PAPI formula. If so, it would have looked like this:
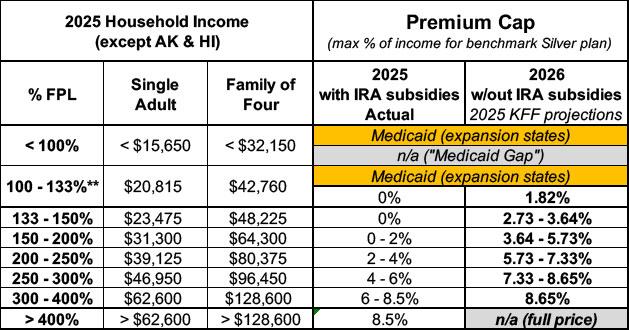
HOWEVER, as I also explained a few months ago, the change in the Premium Adjustment Percentage Index (PAPI) formula by the Trump Regime means that even the non-enhanced tax credit formula will become EVEN LESS generous yet:
January 1, 2026: PAPI formula change to make MOOP higher ($450/$900/yr) (via CMS rule)
CMS is finalizing updates to the methodology for calculating the premium adjustment percentage to establish a premium growth measure that captures premium changes in both the individual and employer-sponsored insurance markets for the 2026 plan year and beyond. CMS is also finalizing the plan year 2026 maximum annual limitation on cost sharing, reduced maximum annual limitations on cost sharing, and required contribution percentage using the finalized premium adjustment percentage methodology.
As a result of this, here's what the 2026 Advanced Premium Tax Credit (APTC) table will actually look like compared to the current (2025) and Biden-era PAPI versions:
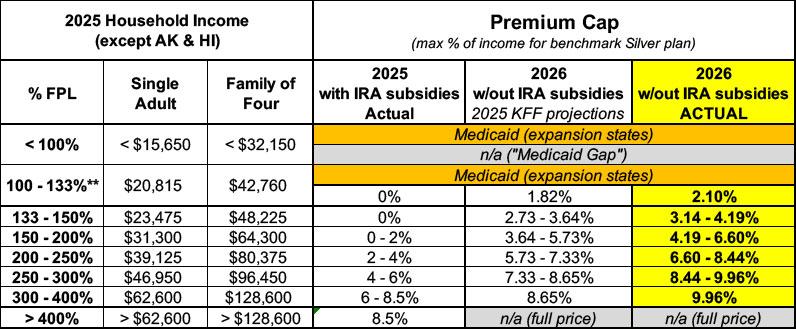
You may notice that the center column specifies "KFF projections." This is because, like myself, the healthcare policy analysis & consulting center KFF was also assuming the Biden-era PAPI formula would be used instead once the enhanced subsidies expire.
This is what KFF used to come up with the 75% average net premium increase which they projected back on July 26th. This "75% average increase" figure has been used in countless headlines & news stories over the past two months, though I've tried my best since then to warn people that the actual average rate hike will be even higher than that.
Today, I'm relieved to report that KFF has completed their own revised, updated version of their analysis to incorporate both the actual 2026 rate filings as well as the modified PAPI formula by CMS, and lo and behold:
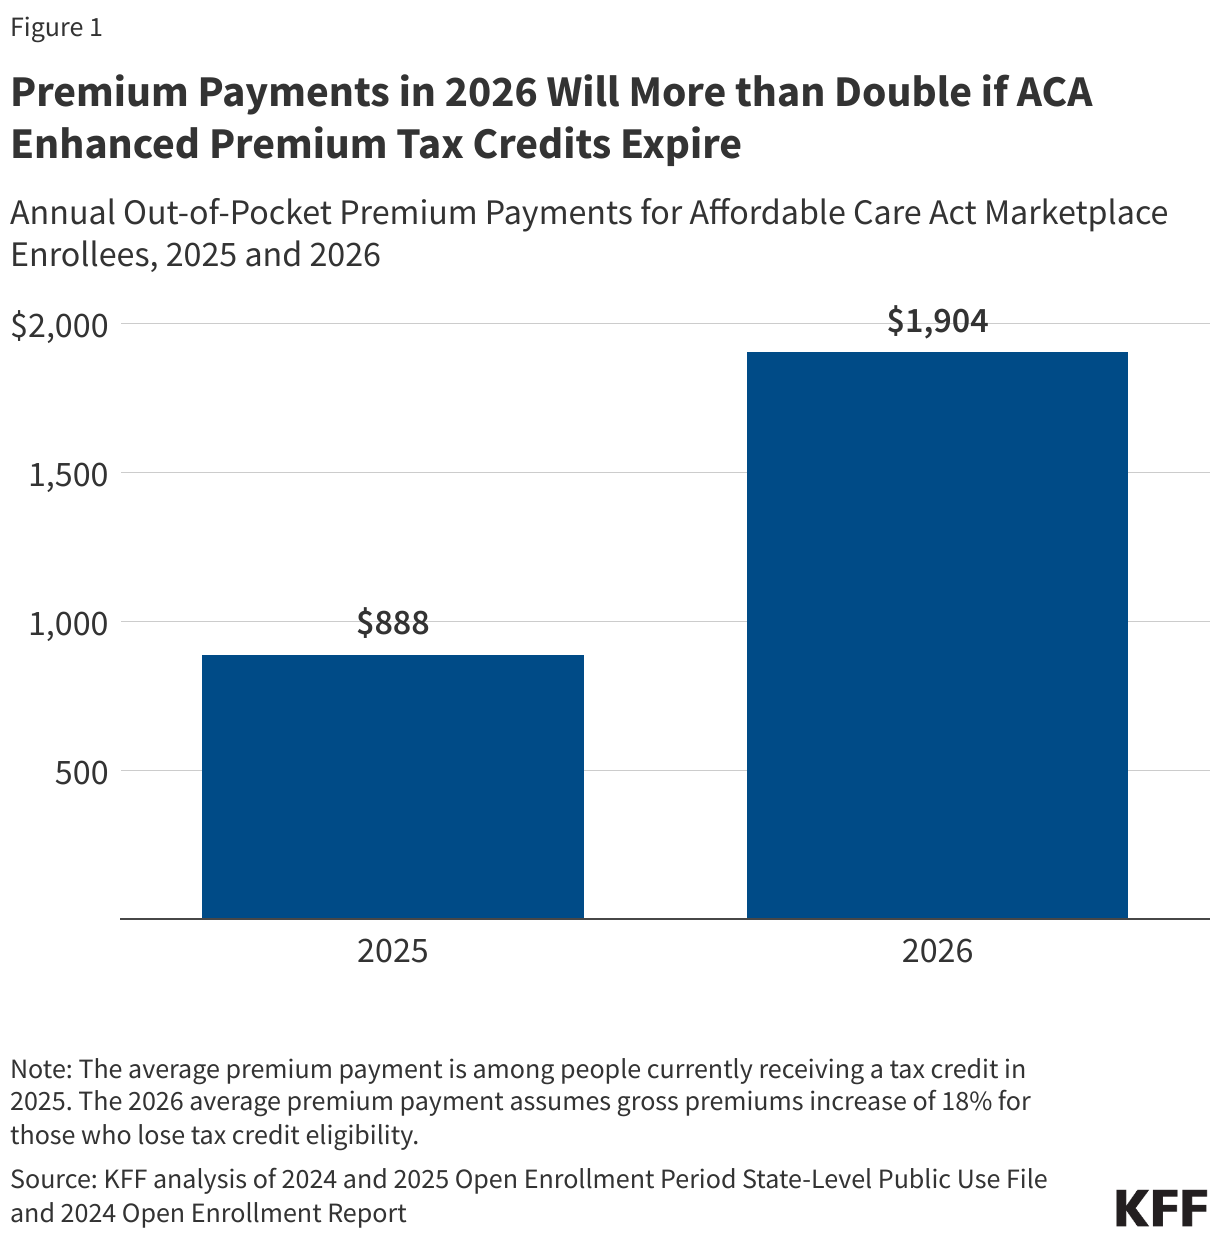
ACA Marketplace Premium Payments Would More than Double on Average Next Year if Enhanced Premium Tax Credits Expire
...A previous KFF analysis, based on data released by the federal government, showed the enhanced premium tax credits saved subsidized enrollees an average of $705 annually in 2024, bringing their annual premium payment down to $888. Without the enhanced premium tax credits, annual premium payments in 2024 would have averaged $1,593 (over 75% higher than the actual $888). More recent data have not been released.
Based on the earlier federal data and more recent other publicly available information, KFF now estimates that, if Congress extends enhanced premium tax credits, subsidized enrollees would save $1,016 in premium payments over the year in 2026 on average. In other words, expiration of the enhanced premium tax credits is estimated to more than double what subsidized enrollees currently pay annually for premiums—a 114% increase from an average of $888 in 2025 to $1,904 in 2026. (The average premium payment net of tax credits among subsidized enrollees held steady at $888 annually in 2024 and 2025 due to the enhanced premium tax credits).

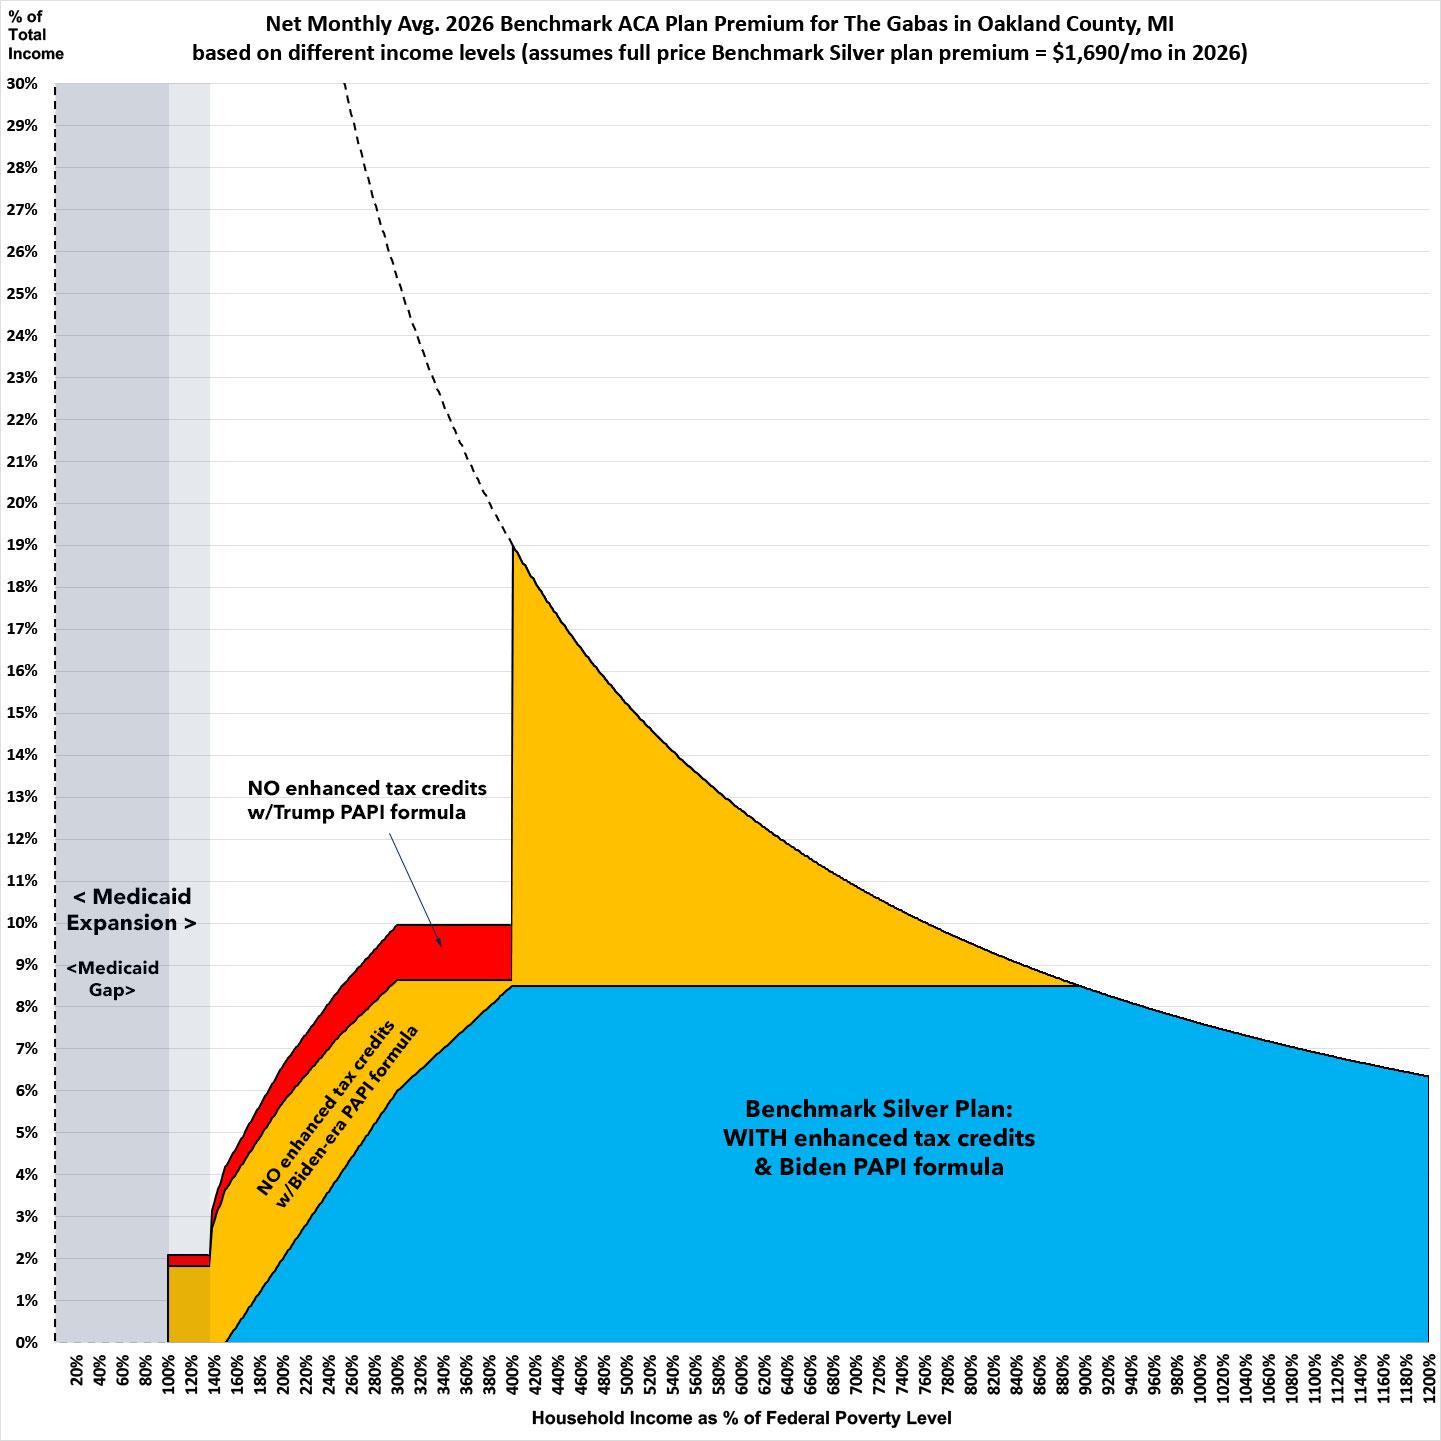
Here's what this looks like visually using my own family as an example here in Oakland County, Michigan. This assumes that the 2025 benchmark Silver plan, which currently costs $1,445/month at full price, increases by 17% (the statewide average for Michigan) to $1,690/month.
The blue section shows what percent of our household income the benchmark Silver plan will cost depending on our annual income. Note how it starts at 0% at 150% of the Federal Poverty Level (FPL) and gradually increases to 8.5% at 400% FPL, after which it locks in until the full price drops below 8.5% of our total income (at roughly 900% FPL).
The orange section shows what it would look like if the enhanced subsidies expired but the Biden-era PAPI formula was kept in place: Net premiums would increase as a percent of income significantly at every point along the 100 - 400% FPL range...and then instantly skyrocket to as much as 19% of our income the moment it moved over the 400% FPL threshold (the "Subsidy Cliff").
The red section is identical to this over 400% FPL, but increases net premiums for everyone earning less than 400% FPL even more, maxing out at just under 10% FPL before once again shooting up at a 90 degree angle once it hits 400% FPL.
P.S. On a related note, if you'd like to support my work here at ACA Signups you can do so here, thanks...
Advertisement
