On April 14th, Covered California reported that 58,000 residents had enrolled in ACA exchange coverage during their COVID-19 Special Enrollment Period, of which roughly 20,000 did so via standard SEPs (losing coverage, moving, getting married/divorced, etc), while an additional 38,000 took advantage of the COVID-specific SEP.
I've made major progress in updating and revising my breakout of COVID-19 cases and fatalities at not just the state level but the county level, and should now be able to post updated summaries of the worst-hit counties on a weekly basis.
Due to the sheer volume of data involved, I've had to separate out the states into two separate spreadsheets:
All data below is up to date as of Saturday, May 16th, although due to variances in when different states report the data, some of the data may be from a day earlier. The counties are color-coded depending on whether they voted for Donald Trump (orange) or Hillary Clinton (blue) in 2016.
Every year, I spend months painstakingly tracking every insurance carrier rate filing for the following year to determine just how much average insurance policy premiums on the individual market are projected to increase or decrease.
Carriers jump in and out of the market, their tendency repeatedly revise their requests, and the confusing blizzard of actual filing forms which sometimes make it next to impossible to find the specific data I need. The actual data I need to compile my estimates are actually fairly simple, however. I really only need three pieces of information for each carrier:
Believe it or not, even though Delaware is a fairly solidly blue state in Presidential elections, two of the three counties there (it's pretty small) voted for Donald Trump in 2016. Here's how the state's cases have shifted over time between New Castle County (the largest of the three, which voted for Clinton) and the other two counties which voted for Trump:
This is almost a complete reversal, with New Castle going from 2/3 of all cases at the beginning of April to just 1/3 today:
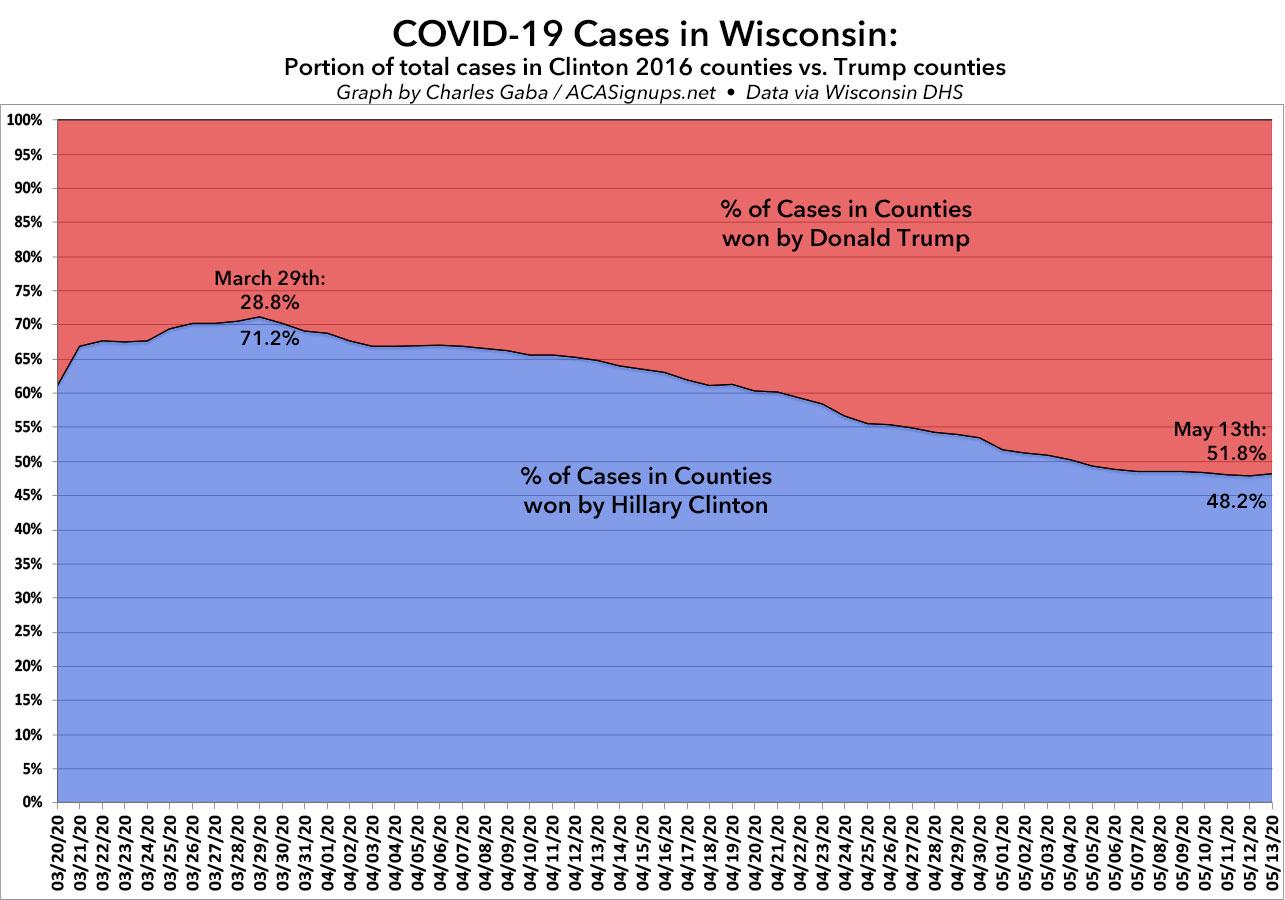
A few weeks ago, I posted a detailed analysis of how the COVID-19 virus has been spreading throughout Wisconsin. I noted that while the outbreak originally spread quickly in the more urban/blue-leaning areas, that has gradually changed over time, with the virus spreading to the rest of the state--including rural, conservative-leaning areas--at a faster rate while it slowed down in the urban areas.
It's time to check in to see whether that trend has continued...and sure enough, it has. Here's what this trend looks like visually:
A few weeks ago, I posted a detailed analysis of how the COVID-19 virus has been spreading throughout my home state of Michigan. I noted that while the outbreak originally spread quickly in Detroit and the more densely-populated Metropolitan Detroit region (Wayne, Oakland and Macomb counties), that has gradually changed over time, with the virus spreading to the rest of the state--including rural, conservative-leaning areas--at a faster rate while it slowed down in the urban areas.
It's time to check in to see whether that trend has continued...and sure enough, it has:
Due to the COVID-19 emergency, Vermont Health Connect has opened a Special Enrollment Period until May 15, 2020. During this time, any uninsured Vermonter can sign up for a Qualified Health Plan through Vermont Health Connect. Qualified families can also get financial help paying for coverage.. Please call us at 1-855-899-9600 to learn more.
More than 14,000 Coloradans gain health coverage during emergency Special Enrollment Period; Marketplace reports higher enrollments and lower costs in 2020
DENVER — A total of 14,263 Coloradans gained health insurance coverage during Connect for Health Colorado’s emergency Special Enrollment Period, which ran from March 20 to April 30. The Marketplace opened the Special Enrollment Period in response to the outbreak of the coronavirus (COVID-19), to ensure as many Coloradans as possible have access to health care.
“We’ve seen a tremendous response to the emergency Special Enrollment Period and need for affordable health coverage,” said Chief Executive Officer Kevin Patterson. “As always, we are here to help Coloradans get covered and stay covered as they navigate life changes this year.”
Regular readers have no doubt noticed that I've let the blog sit mostly idle for the past week or so, even though there's been a ton of noteworthy developments. As I noted on Friday, part of this was due to an emergency laptop replacement/transfer. Part of it was due to it being Mother's Day weekend. Part of it was due to some other personal issues.
This has been far more difficult than you might imagine. While there are a half a dozen great sites out there already doing up-to-date tracking of COVID-19 data at the state level, such as the COVID Tracking Project, WorldoMeters and so forth, when it comes to the county-level data, it's a very different story. Some state health department websites make this data easily available and in an easy-to-read format; others make it next to impossible.
Since tracking and analyzing data is what I'm best known for...and since I'm mostly stuck sitting in front of the computer all day whether I like it or not these days anyway...I've started my own daily COVID-19 spreadsheet.
Again, I'm not the one who compiled the data itself--many other teams with far better resources than I have are doing that--but I'm pulling their work together and adding some additional context, such as per capita info by state/territory.