For my county-level vaccination rate graphs, I go by FULLY vaccinated only (2 doses of the Pfizer or Moderna vaccine or one dose of the Johnson & Johnson vaccine).
I base my percentages on the total population, as opposed to adults only or those over 11 years old.
For 42 states + DC I use the daily data from the Centers for Disease Control, but there are some where the CDC is either missing county-level data entirely or where the CDC data is less than 90% complete at the county level. Therefore:
For Colorado, Georgia, New Mexico and Texas, I'm using their COVID vaccine dashboards set up by the state health departments.
For California, I'm using the CDC data for most counties and the state health dept. dashboard data for the 8 small counties which the CDC isn't allowed to post data for.
The 5 major U.S. territories don't vote for President in the general election, preventing me from displaying them in the main graph, but I have them listed down the right side.
...Blue Counties (ones where Donald Trump received less than 45% of the vote last November) have increased their collective vaccination rate by 10% more per capita than the Red Counties (where Trump received more than 55% of the vote) since July 21st. This is the first time that I've compared how the relative rates have changed over time, so I have no idea if this gap represents an increase or decrease from earlier this spring or summer.
I go by FULLY vaccinated only (2 doses of the Pfizer or Moderna vaccine or one dose of the Johnson & Johnson vaccine).
I base my percentages on the total population, as opposed to adults only or those over 11 years old.
For 42 states + DC I use the daily data from the Centers for Disease Control, but there are some where the CDC is either missing county-level data entirely or where the CDC data is less than 90% complete at the county level. Therefore:
For Colorado, Georgia, New Mexico and Texas, I'm using their COVID vaccine dashboards set up by the state health departments.
For California, I'm using the CDC data for most counties and the state health dept. dashboard data for the 8 small counties which the CDC isn't allowed to post data for.
The 5 major U.S. territories don't vote for President in the general election, preventing me from displaying them in the main graph, but I have them listed down the right side.
Over the past few weeks, as the Delta COVID-19 variant has surged across the country and COVID vaccination rates have plummeted, there's been a growing cry from many vaccinated Americans. Here's just a few examples:
Step up private sector. Mandate vaccinations for employees and consumers. Looking at you health insurance companies. Add insane premiums for those eligible yet refuse to be vaccinated. Deny hospital coverage for chosen unvaccinated hospital care.
It’s clear that new messaging—along with the obvious employer mandate—is having an impact.
Now’s a good time to require vaccines to fly.
Insurance companies should also raise premiums for the unvaccinated. Smokers pay more. Covid is more deadly than smoking—and it’s contagious. https://t.co/ob9d9ofoIn
Regular readers have no doubt noticed that something like 80% of the new posts here at ACA Signups over the past 2-3 weeks have been obsessively tracking COVID-19 vaccination rates via various metrics (partisanship, income, geographic region, education level, etc). While COVID and the vaccination program are obviously heavily healthcare policy-related, they're also obviously not right at the core of what this site is normally about.
This week I'm finally easing off on the vaccination tracking stuff (I'll only be posting about them here weekly going forward--on Wednesdays--with rare exceptions), I wanted to explain why I've been so obsessive about this. A Twitter thread by nurse Julia Pulver (an old friend of mine here in Michigan) explains it better than I could. I've converted her thread into a more blog-friendly format with her permission:
One of the most traumatic experiences I ever had in an ICU was performing end of life care for a 34yr mother of 3. She had advanced breast cancer & there was nothing more that could be done-she was in multi-system organ failure.
NOTE: The original version of this post included a serious, bone-headed data error on my part, requiring me to pull the post and revamp it just minutes after it went live. After the main post I'll explain how I screwed up and how I've resolved the issue. The bottom line is that my premise may still be correct, but if so it won't be nearly as dramatically as I had originally thought.
Generally speaking, however, it sure sounds to me like someone in the GOP now believes that their 6-month anti-vaxx propaganda campaign is starting to kill off their own voter base, because everyone from Sean Hannity to Florida Governor Ron "Don't Fauci my Florida" DeSantis seem to have finally gotten the memo.
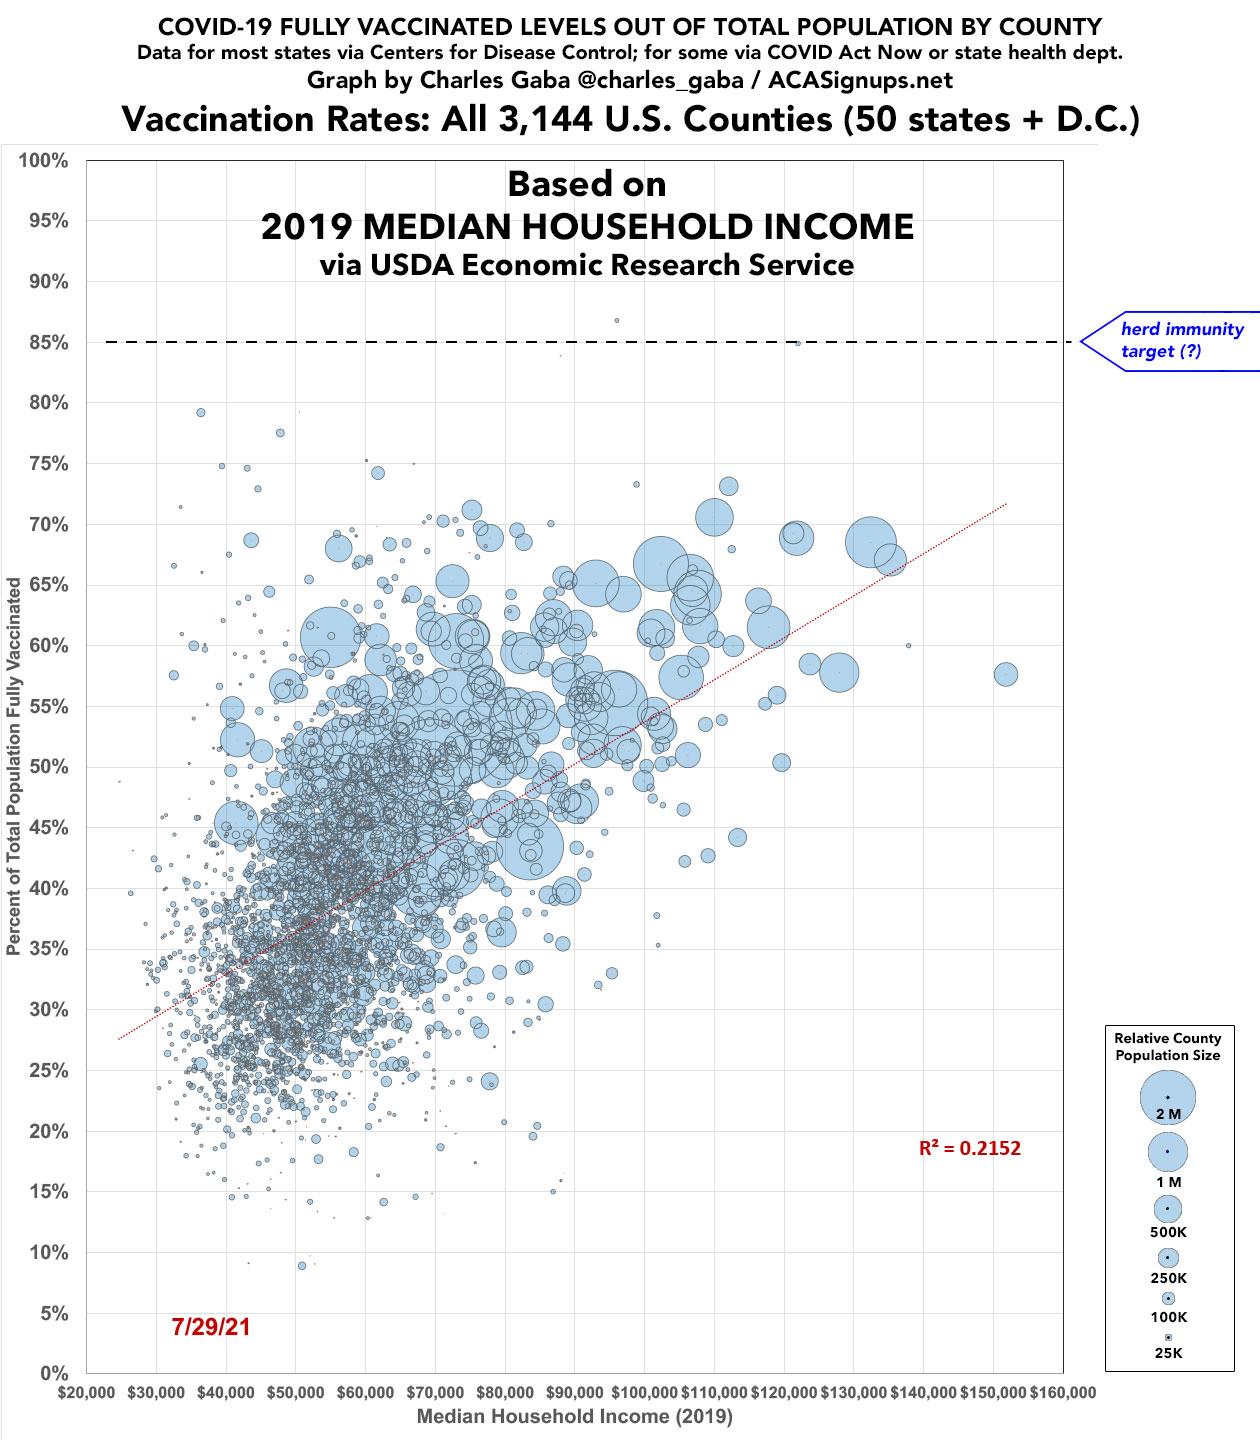
Today I'm looking at county-level U.S. vaccination rates via two other factors: Income and Education.
For Income, I'm using the USDA Economic Research Service's estimate of Median Household Income from 2019 (which was, of course, the last year before COVID-19 hit the U.S. in the first place).
The lowest countywide median household income in 2019 was around $25,000/year (Clay County, Georgia); the highest was roughly $152,000/year (Loudoun County, Virginia):
One of the biggest criticisms I've received with my county-level vaccination level project is that I haven't taken into account a rather obvious truth about the partisan divide in America: Democrats tend to cluster in much more densely-populated urban areas while Republicans tend to live in more sparsely-populated rural areas.
In addition, regardless of your political lean, you might expect it to be a lot more difficult to get vaccinated if you live out in the middle of the boonies where the nearest hospital, clinic or pharmacy is 50 miles away or whatever...not to mention that if you're the only one for miles around, you might be less likely to see getting vaccinated as a high-priority task regardless of your ideology.
Therefore, the reasoning goes, instead of looking at the partisan lean of each county, it would make much more sense to see how much correlation there is based on population density or whether it's a more urban or rural region, right?
I was planning on only updating the county-level vaccination graph monthly, but given the attention this has received via high-profile folks like David Frum and Paul Krugman, I've decided to post updates weekly.
Let's be clear: There's a good ~48 million or so children under age 12 who haven't been approved to take the COVID-19 vaccine yet, roughly 14% of the population. There's also perhaps 8 - 9 million Americans age 12+ who are immunocompromised or have serious allergic reactions to vaccinations, meaning the vaccine would have no effect on them or they can't take it at all. Combined, that's around 17% of the total U.S. population who can't get vaccinated, leaving it up to the other 83% of us who can to do so.