

Has the GOP's sudden vaccination 180º lit a fire under the asses...of Blue counties? Well...maybe.
Fri, 07/30/2021 - 7:26pm
NOTE: The original version of this post included a serious, bone-headed data error on my part, requiring me to pull the post and revamp it just minutes after it went live. After the main post I'll explain how I screwed up and how I've resolved the issue. The bottom line is that my premise may still be correct, but if so it won't be nearly as dramatically as I had originally thought.
As I noted a week ago, something very interesting has changed on the GOP side of the political and media punditry aisle:
Generally speaking, however, it sure sounds to me like someone in the GOP now believes that their 6-month anti-vaxx propaganda campaign is starting to kill off their own voter base, because everyone from Sean Hannity to Florida Governor Ron "Don't Fauci my Florida" DeSantis seem to have finally gotten the memo.
As Josh Marshall noted over at Talking Points Memo:
There aren’t any good answers. But the most plausible bad answer continues to be bad polling. Perhaps not literally polling. There are other gauges of public opinion: focus groups, reactions at townhalls. My best guess is that Republicans see that a lot of their constituents – despite the tough talk on Twitter – are suddenly pretty worried about COVID. And because of that – somehow – Republican politicians suddenly feel exposed. Like they’re the ones holding the ‘poo-poo COVID, don’t get vaccinated’ bag when their voters are freaking out.
Whatever the reason, the entire GOP leadership and their allies at FOX News and other right-wing outlets have suddenly done a complete turnaround and have finally started hammering home the importance of the GOP base getting off their butts and getting vaccinated, especially in the lowest-vaxxed, reddest areas of the country in the South and Appalachia.
So, is it working? Well, according to Drew Armstrong of Bloomberg News, it seems to be. As he tweets (the story itself is behind a paywall):
In some of the places hit hardest by the new Covid wave (including many vaccine-lagging places), the surge in cases has been followed up a surge in vaccinations. Check these maps. Blue is where vaccinations are highest. Yellow is where cases are.
...In Louisiana, Missouri and Arkansas in particular, there's been a rebound in vaccinations to levels not seen since the spring. They're reporting the highest rate of new vaccinations since mid-April in Arkansas + Louisiana, and since late May in Missouri
...We divided ~2500 U.S. counties into quintiles based on their June 15 daily vaccine rate (7 day avg). From mid-June to now, the slowest vaccinating 20% of the country has become the fastest vaccinating 20%.
...Now, of course, some of this is caused by high-vaccinating counties hitting a ceiling. But new vaccinations are up everywhere over the last week or two, since a low point in mid-July.
This is great news, and it certainly makes it sound like MAGA America has finally decided to get the jab after all.
However...while Trump Country makes up the bulk of the lagging portions of the country, there are also some deep Blue areas which have been lagging behind as well. I decided to take a look at where this sudden vaccination mini-surge (from ~300K - 400K per day to ~700K - 800K/day over the past week or so) has been concentrated.
Fortunately, I have a perfect starting point.
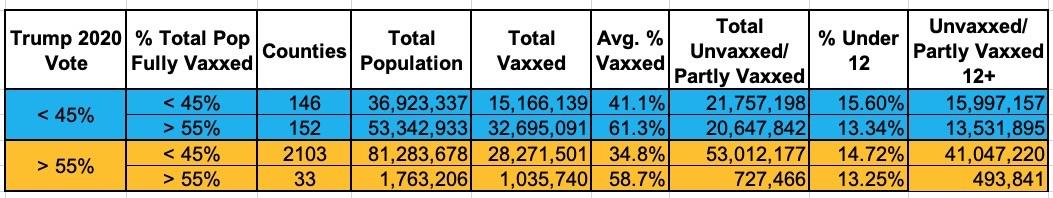
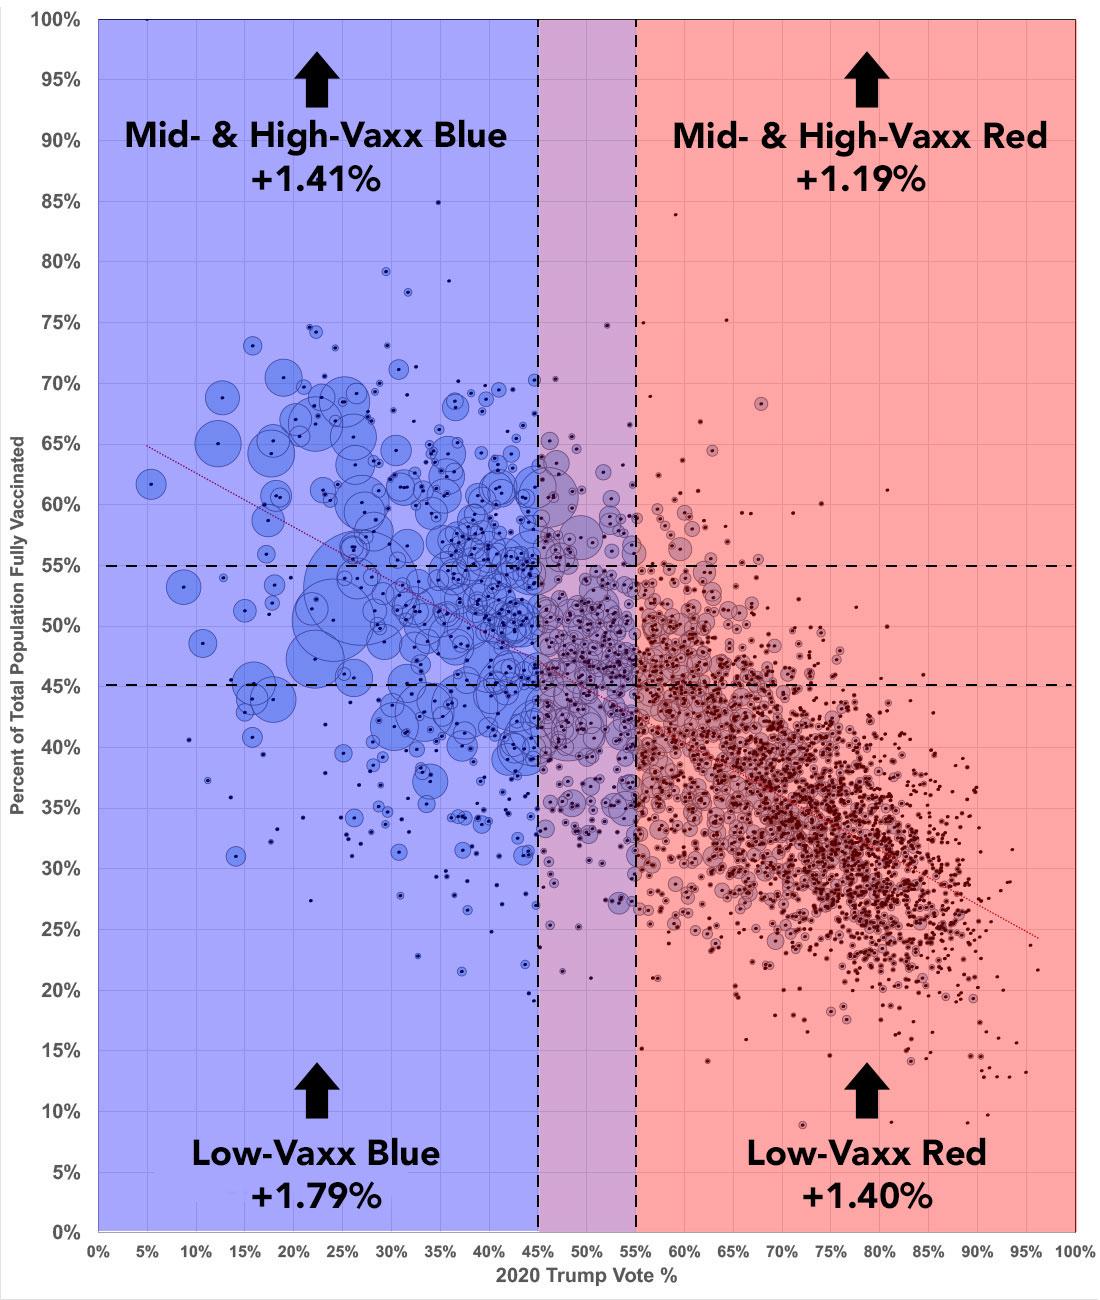
On July 21st (shortly after the GOP seemed to start their coordinated messaging reversal), I separated out four categories of counties in the COVID-19 vaccination process:
- 146 counties are "low-vaxx Blue"...that is, counties in which less than 45% of the total population had been fully vaccinated and where Donald Trump received less than 45% of the vote last fall.
- 152 counties are "high-vaxx Blue"...more than 55% vaccinated, where Trump received less than 45% of the vote
- 2,103 counties are "low-vaxx Red"...less than 45% vaccinated, Trump received more than 55% of the vote
- 33 counties are "high-vaxx Red"...more than 55% vaxxed, Trump received more than 55%
The breakout was as follows:
At the time I was looking at the first and last quadrants--the outliers in the low-vaxx Blue and high-vaxx Red categories.
Today, however, I want to look at the first and third categories (both low-vaxx Blue and low-vaxx Red) to see how they've changed over the past week or so. There were around 36.9 million people living in the first quadrant and 81.3 million in the third, or around 118.2 million Americans total between them.
More to the point, there were around 21.8 million unvaxxed residents of the Low-Vaxx Blue counties and 53.0 million unvaxxed in the Low-Vaxx Red counties.
As a reminder, here's what they looked like graphically:
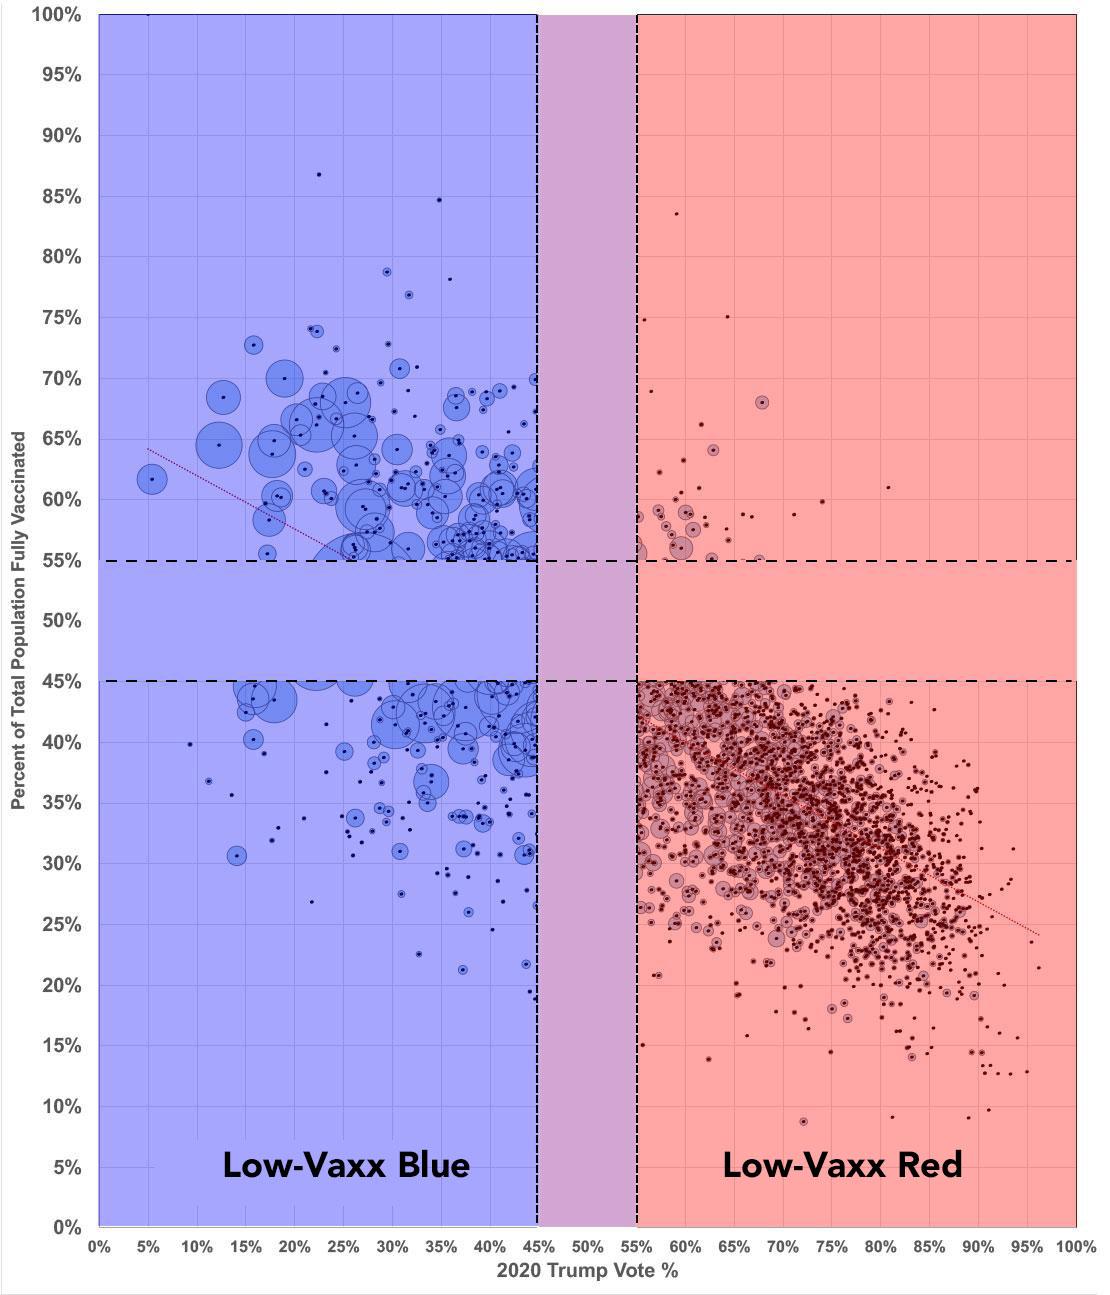
As you may recall, of the 146 counties in the lower-left quadrant:
- 79 are majority Black
- 19 more have at least a 40% Black population
- 8 have a majority Native American population
That's right: 73% of these counties are heavily BIPOC.
Meanwhile, of the 2,103 Low-Vaxx Red counties, all except a handful are majority White (in fact, nearly 1,900 of them, or roughly 90% of the counties, are over 70% White), which isn't terribly surprising given that, again, this is solid Trump country.
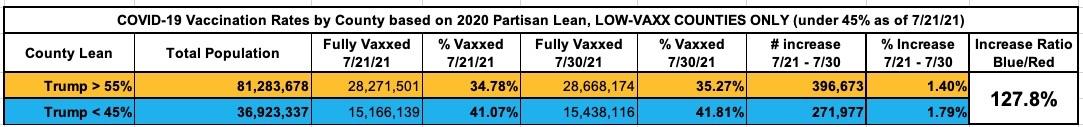
If the GOP's new strategy of lighting a fire under the asses of their supporters is working, you'd expect these ~2,100 counties to start moving up the vaccination ladder, right?
Well, as of today (July 30th, 9 days later) that has started to happen...a little. The number of fully-vaccinated residents of those counties has increased by 1.40% (over 396,000 people).
Over the same time period, however, the number of vaccinated residents of the low-vaxx blue counties has increased by 1.79% (272,000 people).
In other words, the rate of increase from 7/21 - 7/30 is 28% higher in the lower-left quadrant than the lower-right one:
What about the other red and blue sections? Perhaps the uptick is higher in the mid-vaxx and high-vaxx Trump counties? Actually, it's lower...although to be fair, it's lower for both blue and red counties alike. As Armstrong noted, the lowest-vaccinated counties have seen the highest rate of increase recently regardless of where they fall on the partisan scale. It's just that blue counties are continuing to outpace the red counties even at that level:
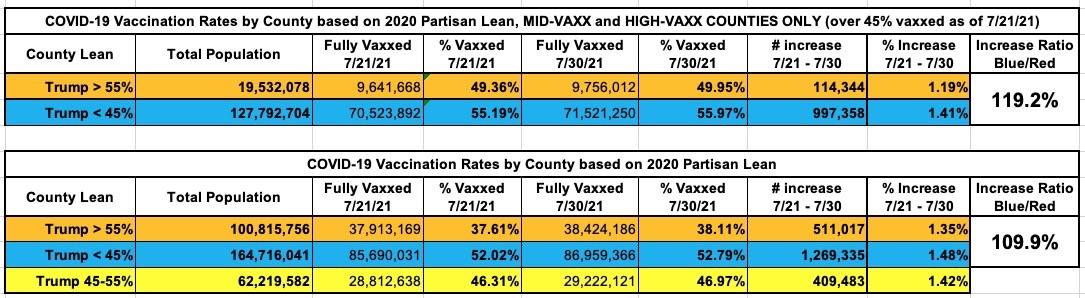
It's also worth noting that overall, the Blue counties have increased their fully-vaccinated populations 10% faster than the Red counties since the 21st, and currently average 14.7 points higher out of their total populations (52.8% vs. 38.1%).
Here's what this looks like visually:
Now, there are some important caveats to keep in mind here:
- Dr. Jorge Caballero rightly pointed out that some of the increases across the board could be a matter of a housecleaning push in which the CDC has managed to assign a county to a chunk of existing "county unknown" vaccinated state residents (at any given time there have been several million of these scattered throughout the states). I don't know whether the CDC has had greater success at cutting down the number of unassigned residents in one state vs. another, however, so until I hear otherwise, I have to assume any impact from this has been spread out fairly evenly.
- My spreadsheet is based on fully-vaccinated residents of each county only. Given the lag time between someone getting their first and second dose, a lot of this increase predates the GOP's turnaround (the exception is those who have gotteb the one-shot Johnson & Johnson vaccine since 7/20 or so). It will likely take another 2-3 weeks before any impact from the GOP's messaging turnaround really starts showing up (or not) in the data.
OK, so I made two major methodology errors with this project: The first was not waiting long enough, as noted above. I should have waited 3-4 weeks later instead of 9 days.
HOWEVER, that's NOT the major error I made last night. That mistake was even dumber.
On July 21st, I noted there were 146 low-vaxx Blue counties with 36.9 million residents and 2,103 low-vaxx Red counties with 81.3 million residents which fell below the 45% vaccination threshold.
By July 30th, seven of those Blue counties and 20 of those Red counties had risen ABOVE the 45% threshold. This makes sense since, of course, a county that was at 44.9% would likely inch above the cut-off line 9 days later.
The mistake I made was to completely forget about those 27 counties. In effect, I was subtracting the entire unvaccinated populations of them as if all 27 had magically achieved 100% vaccination rates since 7/21. Obviously this didn't happen.
Now, if all 27 counties had been low-population, this might not have made a significant difference (and in fact I might never have even realized my obvious-in-retrospect error). HOWEVER...the seven Blue counties happen to include:
- The Bronx (1.4 million residents)
- Mecklenburg, NC (1.1 million)
- Forsyth, NC (382K)
- Cumberland, NC (335K)
And it wasn't just the Blue counties I was massively off on. Among the 20 Red counties were Galveston, TX (342K) and Clermont, OH (206K).
In short, I foolishly thought that the low-vaxx Blue counties had increased their vaccinated populations by nearly five times as many per capita as the low-vaxx Red counties. Instead it's a far more modest 28%. Still noteworthy, mind you (or at least it will be in a few weeks, assuming the data still supports the discrepancy), but not an earth-shattering gap.
My apologies for both errors. I'll cool my jets on this issue until late August and will revisit it (properly) at that time.
Advertisement
