

Weekly Update: U.S. #COVID19 vaccination levels BY COUNTY & Partisan Lean
Tue, 08/03/2021 - 11:47pm
As a reminder:
- I go by FULLY vaccinated only (2 doses of the Pfizer or Moderna vaccine or one dose of the Johnson & Johnson vaccine).
- I base my percentages on the total population, as opposed to adults only or those over 11 years old.
- For 42 states + DC I use the daily data from the Centers for Disease Control, but there are some where the CDC is either missing county-level data entirely or where the CDC data is less than 90% complete at the county level. Therefore:
- For Hawaii, Vermont, Virginia and West Virginia, I'm using data from the COVID Act Now Risk & Vaccine Tracker database.
- For Colorado, Georgia, New Mexico and Texas, I'm using their COVID vaccine dashboards set up by the state health departments.
- For California, I'm using the CDC data for most counties and the state health dept. dashboard data for the 8 small counties which the CDC isn't allowed to post data for.
- For Massachusetts, I'm using the CDC data for most counties but this municipality-level data for Barnstable, Dukes & Nantucket counties, which the CDC only has partial data for.
- The 5 major U.S. territories don't vote for President in the general election, preventing me from displaying them in the main graph, but I have them listed down the right side.
Worth noting:
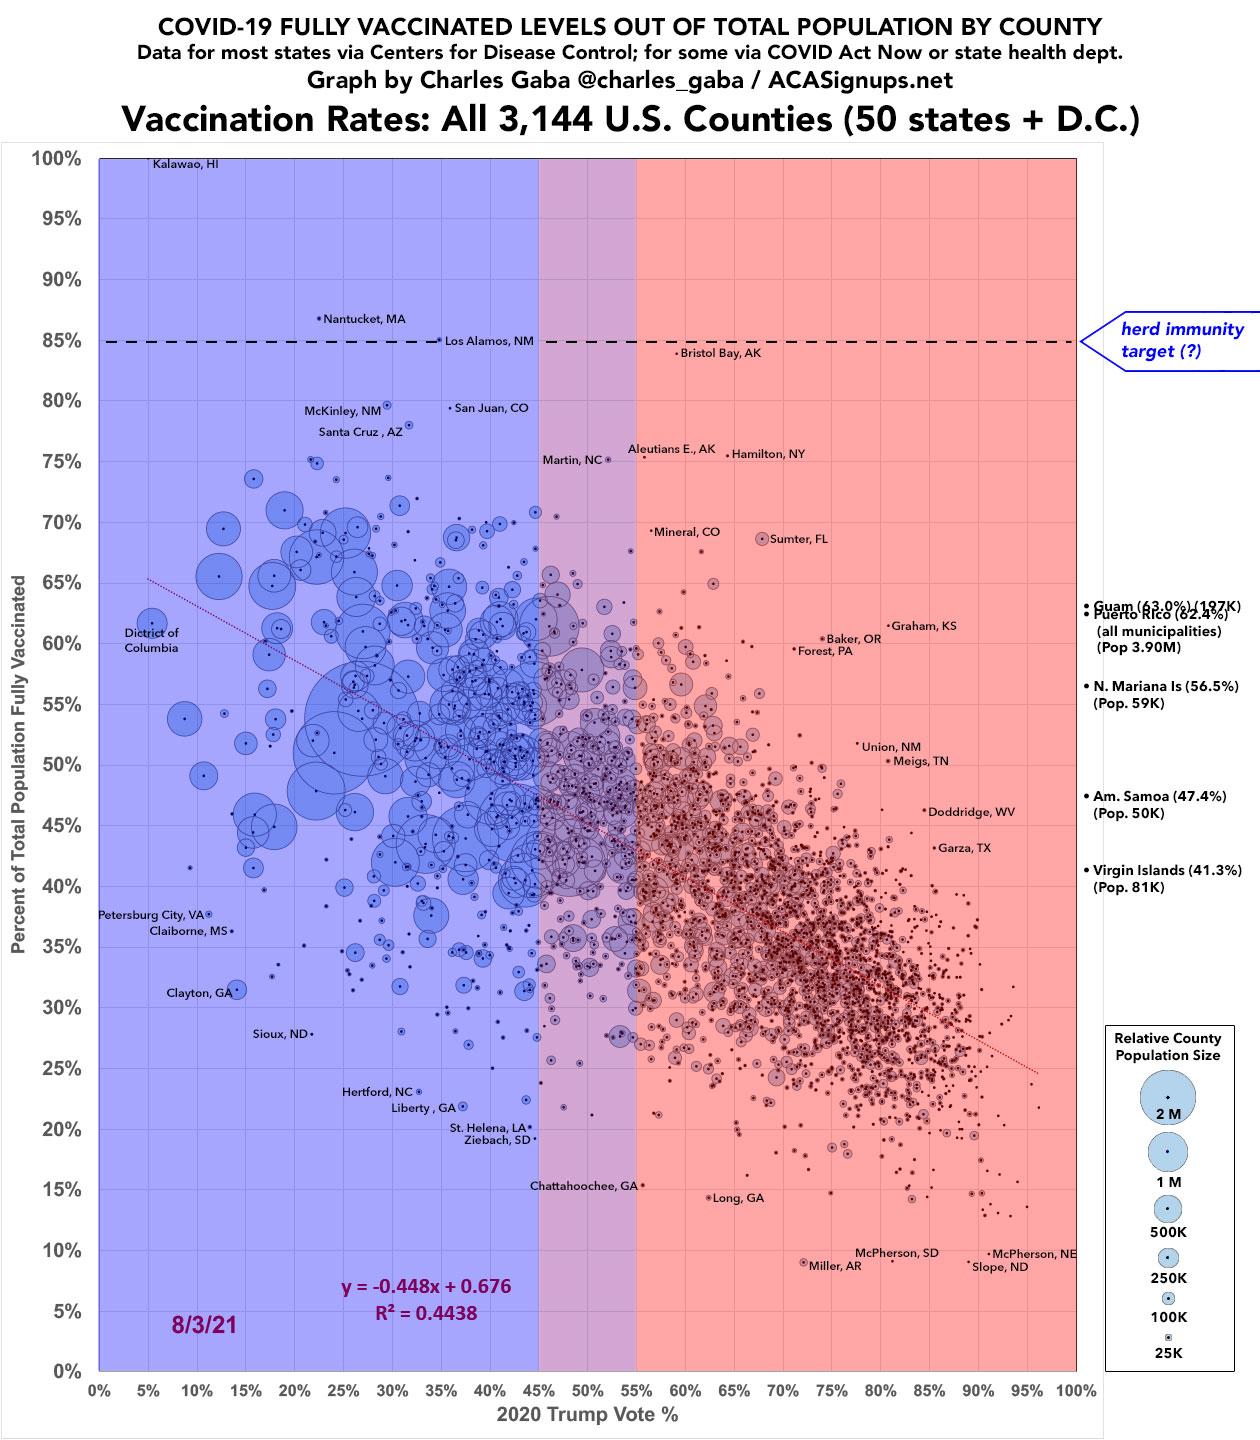
- At first glance, the graph may look identical to prior weeks, but the R^2 is gradually increasing:
- On May 25th, R^2 stood at 0.2650 (granted, I had some methodology errors at the time)
- On July 3rd, R^2 stands at 0.4216
- On July 11th, R^2 stands at 0.4270
- On July 20th, the R^2 stood at 0.4363
- On July 27th, the R^2 stood at 0.4408
- On August 3rd, the R^2 stood at 0.4438
- Only 3 counties have broken the 85% threshold for full vaccination: Kalawao County, HI (pop. 86), Nantucket, MA (pop. 11,400) and Los Alamos County, NM (pop. 14,700). Bristol Bay Borough, AK (pop. 900) is next in line, however, at 83.9%.
- Miller County, AR (pop. 43,200) has the lowest vaccination rate in the country at just 9.0%. It's one of 4 counties nationally which have vaccinated less than 10% of their total populations, along with Slope County, ND (pop. 750), McPherson County, SD (pop. 2,400) and McPherson County, NE (pop. 500).
- Of counties with more than 100,000 residents, the top-vaxxed are Santa Fe, NM (74.9% vaxxed); Marin County, CA (73.6% vaxxed); and Cumberland County, ME (71.4% vaxxed)
- Of counties with more than 100,000 residents, the least-vaxxed are Shelby County, AL; Livingston County, LA; and Robeson County, NC, none of which have vaccinated more than 26% of their total populations to date.
- There are 45 counties with more than 1 million residents. Of those, the highest-vaxxed is Montgomery County, MD (71.0% vaxxed) while the lowest-vaxxed is San Bernadino County, CA (40.5%).
It's also worth noting that the Blue Counties (ones where Donald Trump received less than 45% of the vote last November) have increased their collective vaccination rate by 10% more per capita than the Red Counties (where Trump received more than 55% of the vote) since July 21st. This is the first time that I've compared how the relative rates have changed over time, so I have no idea if this gap represents an increase or decrease from earlier this spring or summer.
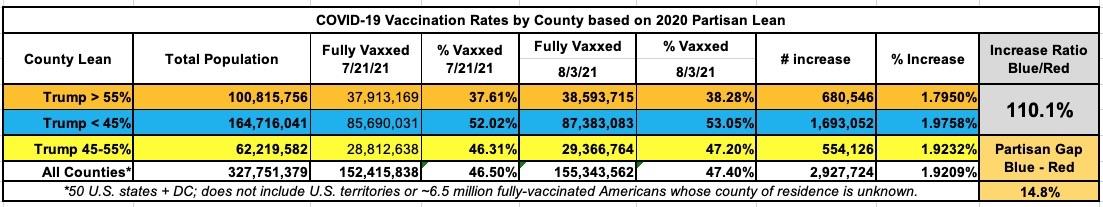
It's possible that this trend will reverse itself once the effects of the Republican Party's recent vaccination messaging turnaround starts to kick in. Since I'm only reporting fully-vaccinated data, any such impact won't start showing up on my graph until around August 11th and beyond, since that will be roughly 3 weeks after the GOP did a 180 and started pushing their base to actually get vaccinated after all (i.e., that's when anyone who ran out and got their first Pfizer shot the week of July 21st will be getting their second one; for Moderna it will take another week beyond that).
Stay tuned...
Advertisement
