

How much difference does population density & urban/rural status make re. vaccination levels?
Wed, 07/28/2021 - 3:31pm
One of the biggest criticisms I've received with my county-level vaccination level project is that I haven't taken into account a rather obvious truth about the partisan divide in America: Democrats tend to cluster in much more densely-populated urban areas while Republicans tend to live in more sparsely-populated rural areas.
In addition, regardless of your political lean, you might expect it to be a lot more difficult to get vaccinated if you live out in the middle of the boonies where the nearest hospital, clinic or pharmacy is 50 miles away or whatever...not to mention that if you're the only one for miles around, you might be less likely to see getting vaccinated as a high-priority task regardless of your ideology.
Therefore, the reasoning goes, instead of looking at the partisan lean of each county, it would make much more sense to see how much correlation there is based on population density or whether it's a more urban or rural region, right?
Fair enough. I decided to do just that:
- FIRST, I graphed out the fully-vaccinated percentages for the 3,144 U.S. counties in all 50 states +DC based on their overall population density...that is, the total number of residents per square mile. The population of each county is via the U.S. Census Bureau's 2019 estimates; the square mileage of each county comes from the U.S. Census Bureau's 2010 Census results. Here's what it looked like as of July 27, 2021 (note: I had to use a logarithmic scale on the graph in order to fit every county in, since Manhattan (71,490 residents per square mile) has a population density nearly 1.8 million times as high as the Yukon-Koyukuk area of Alaska (0.04/sq. mile):
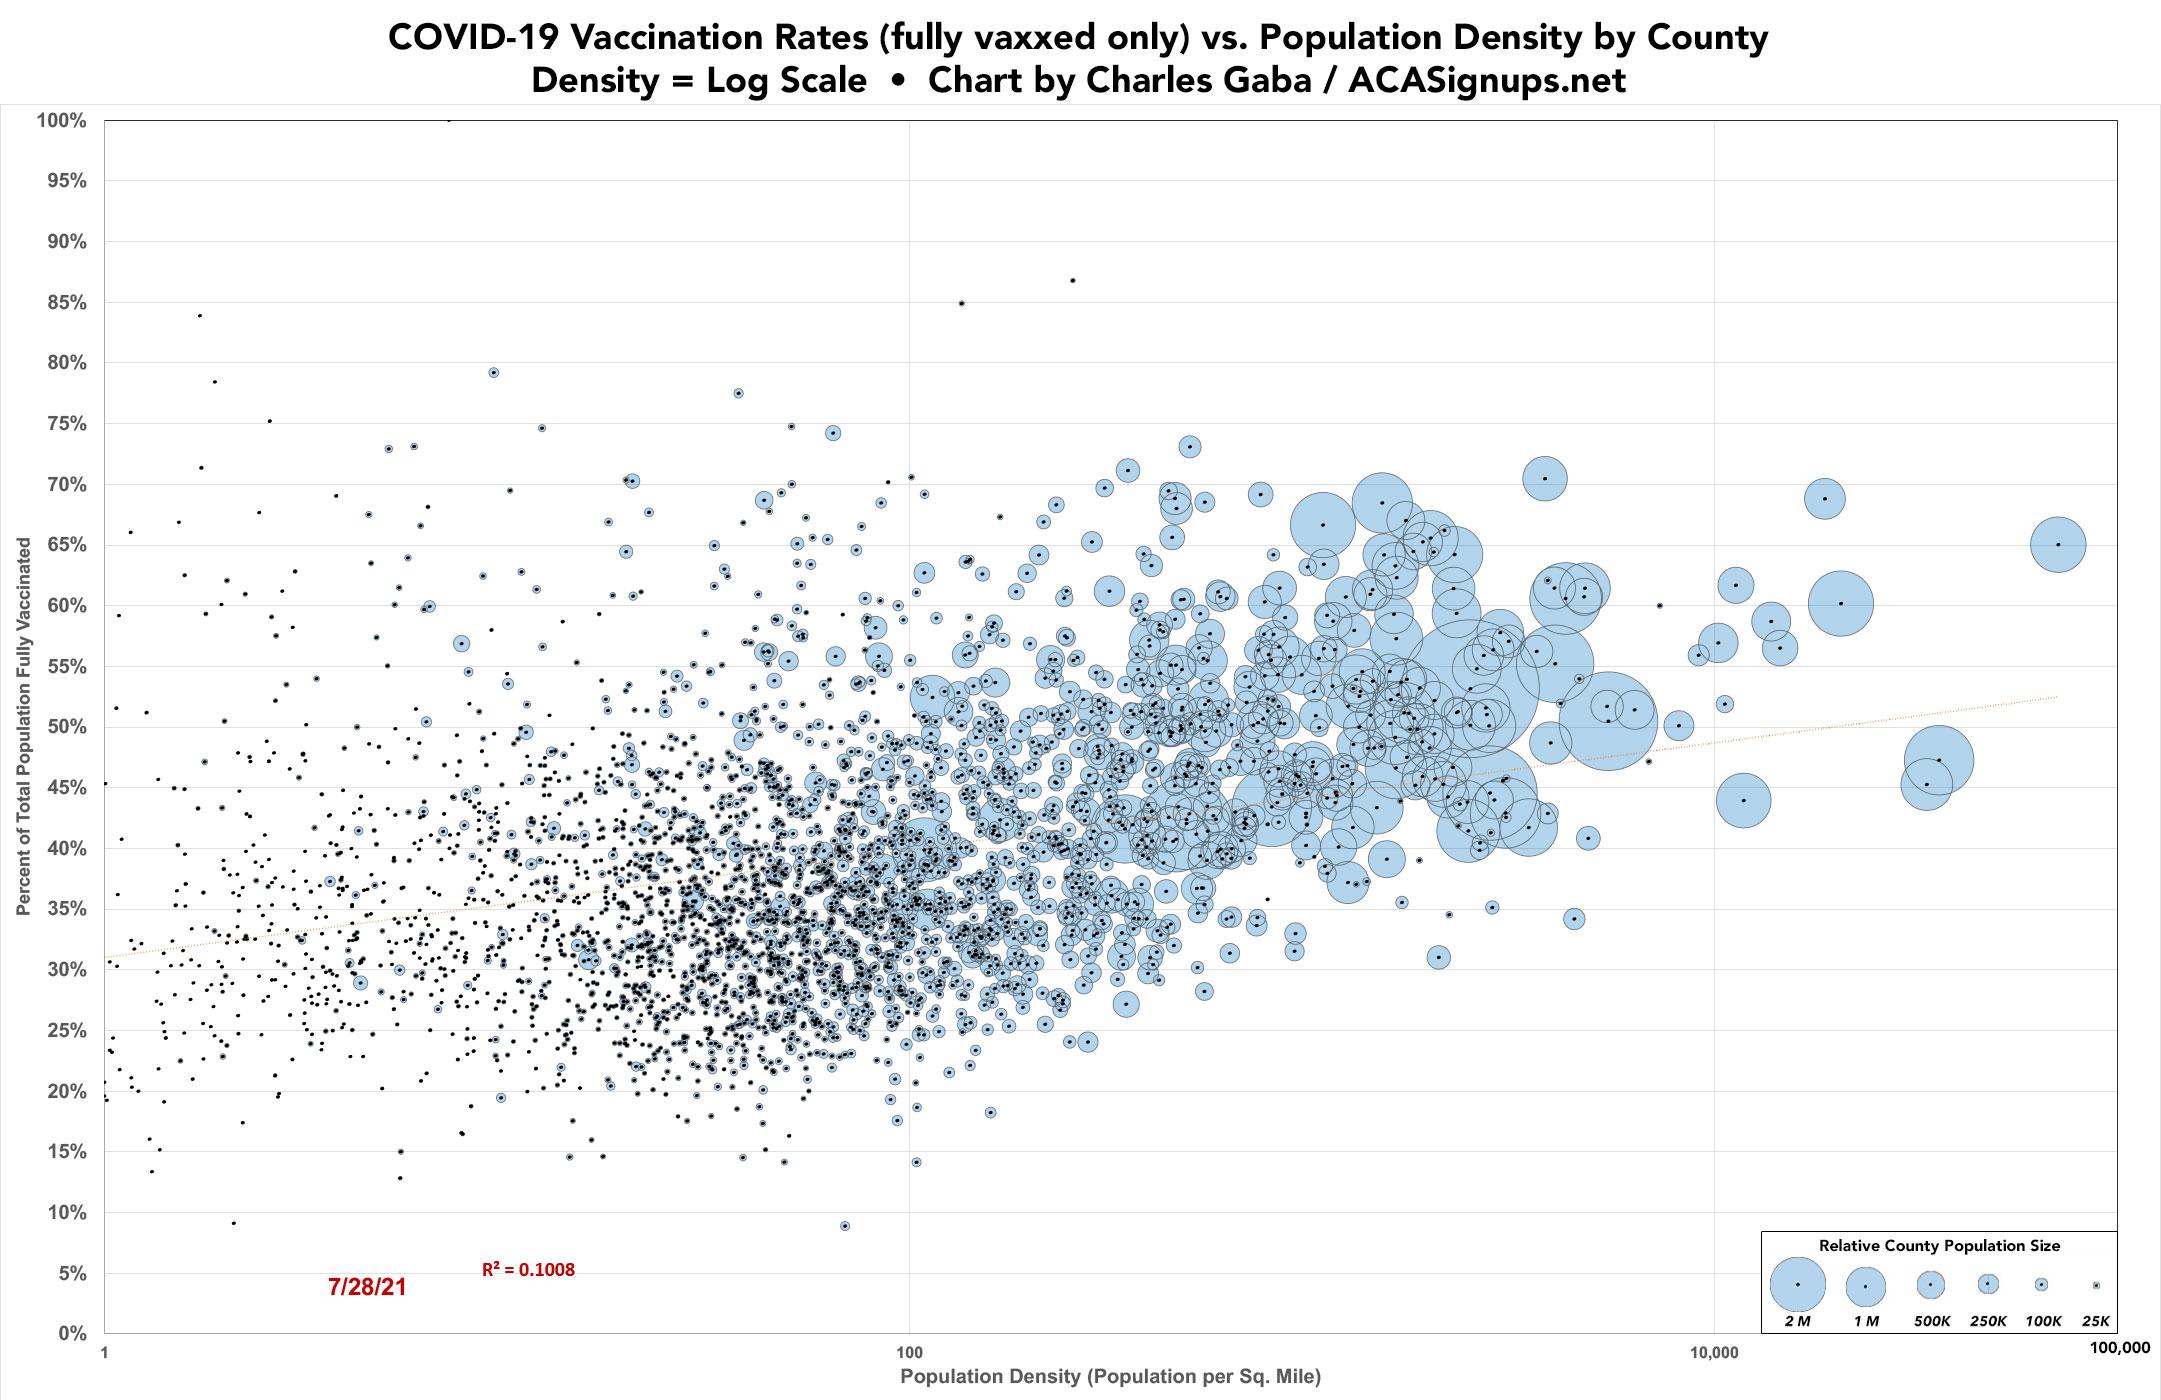
Huh. As you can see, while there's a slight correlation as population density increases, it's pretty weak tea. Not only is the R^2 very low, even the slope is extremely slight. Remember, this is a logarithmic scale--on a linear graph, the right edge of the it would extend to the opposite end of my house.
- NEXT, I looked at the same data a different way: I used the 2013 USDA Economic Research Service's Rural-Urban Continuum Codes:
The 2013 Rural-Urban Continuum Codes form a classification scheme that distinguishes metropolitan counties by the population size of their metro area, and nonmetropolitan counties by degree of urbanization and adjacency to a metro area. The official Office of Management and Budget (OMB) metro and nonmetro categories have been subdivided into three metro and six nonmetro categories. Each county in the U.S., municipio in Puerto Rico, and Census Bureau-designated county-equivalent area of the Virgin Islands/other inhabited island territories of the U.S. is assigned one of the 9 codes.
This scheme allows researchers to break county data into finer residential groups, beyond metro and nonmetro, particularly for the analysis of trends in nonmetro areas that are related to population density and metro influence. The Rural-Urban Continuum Codes were originally developed in 1974. They have been updated each decennial since (1983, 1993, 2003, 2013), and slightly revised in 1988. Note that the 2013 Rural-Urban Continuum Codes are not directly comparable with the codes prior to 2000 because of the new methodology used in developing the 2000 metropolitan areas. See the Documentation for details and a map of the codes.
An update of the Rural-Urban Continuum Codes is planned for mid-2023.
OK, so the data is a bit out of date, but it's the best I can do for now. Again, they've fit all 3,144 counties into one of 9 urban/rural categories. From left to right, these are:
- Metro - Counties in metro areas of 1 million population or more
- Metro - Counties in metro areas of 250,000 to 1 million population
- Metro - Counties in metro areas of fewer than 250,000 population
- Nonmetro - Urban population of 20,000 or more, adjacent to a metro area
- Nonmetro - Urban population of 20,000 or more, not adjacent to a metro area
- Nonmetro - Urban population of 2,500 to 19,999, adjacent to a metro area
- Nonmetro - Urban population of 2,500 to 19,999, not adjacent to a metro area
- Nonmetro - Completely rural or less than 2,500 urban population, adjacent to a metro area
- Nonmetro - Completely rural or less than 2,500 urban population, not adjacent to a metro area
It's important to note that a county being categorized as #1 does not mean the county has more than a million residents (only around 40 or so counties have hit the 1M+ threshold). It just means that the county is located within a metropolitan area which has at least a million people.
Here's what that looks like:
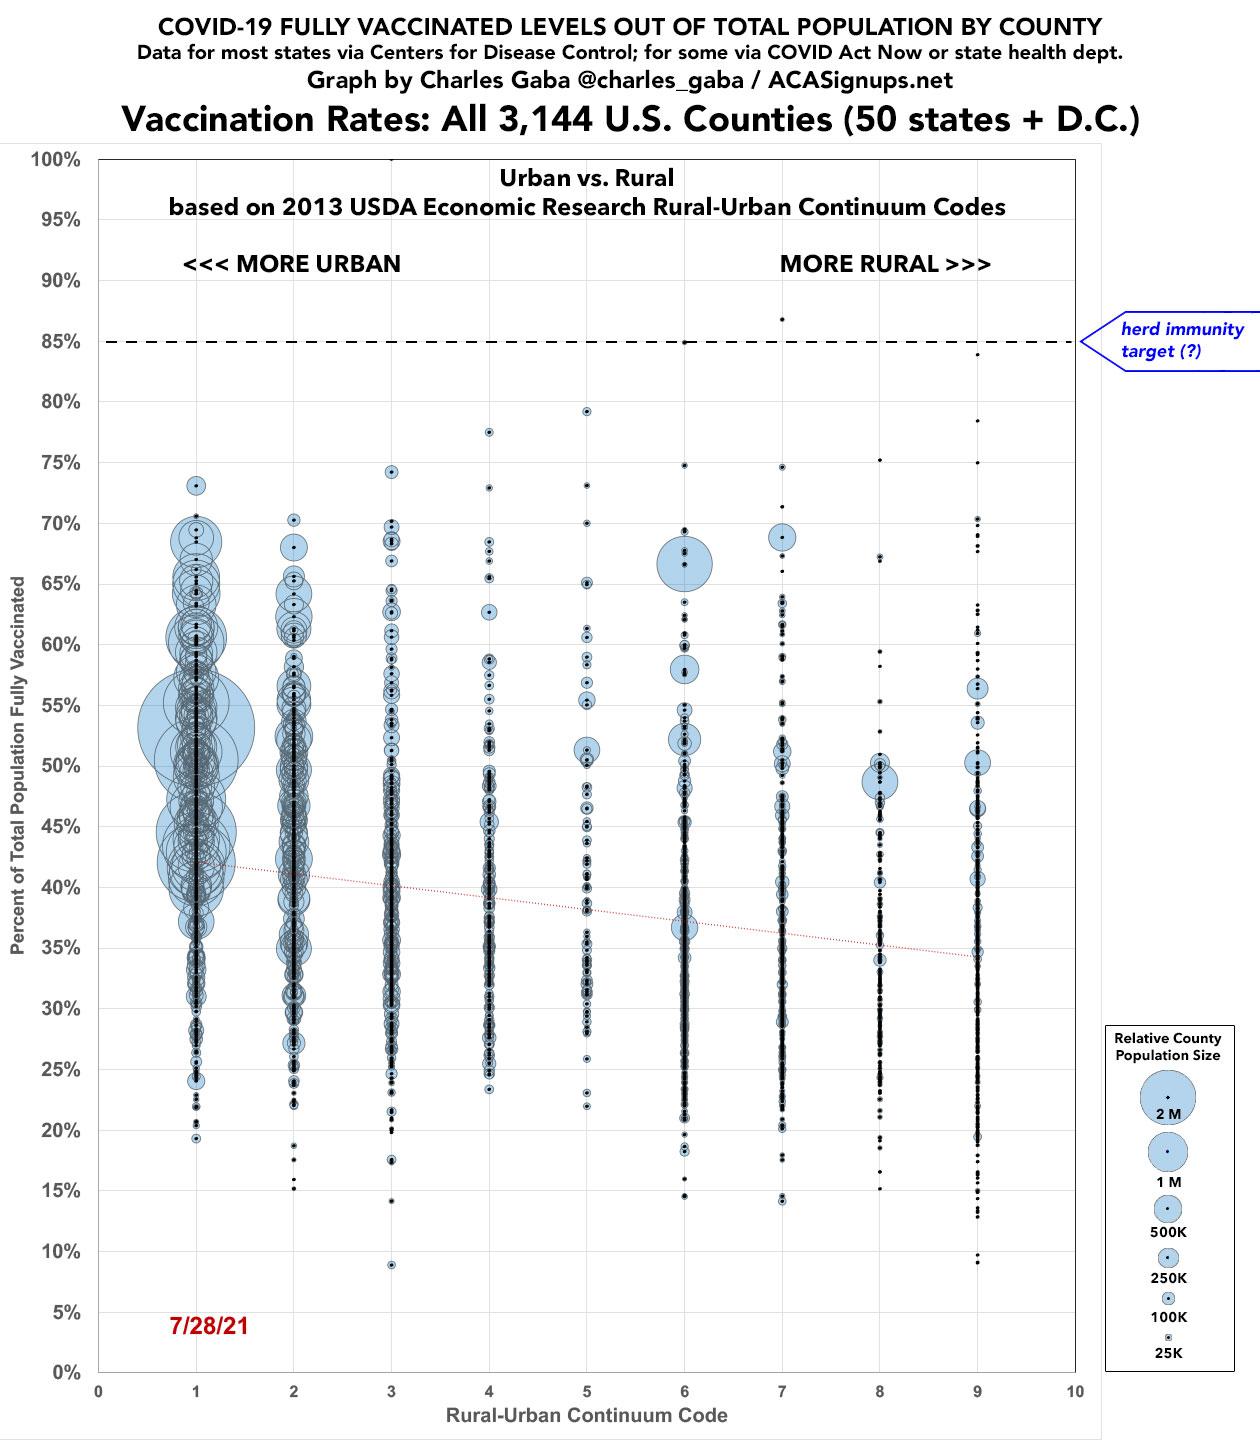
Again, there's a slight correlation as you move from more urban/metro counties to more rural/non-metro counties...but it looks pretty weak to me.
Put another way, here's the average vaccination levels of the counties in all 9 categories:
- Metro (432 counties): 169.9 million people, 49.9% fully vaxxed
- Metro (367 counties): 64.6 million people, 46.0% fully vaxxed
- Metro (347 counties): 26.1 million people, 41.3% fully vaxxed
- Nonmetro (211 counties): 12.9 million people, 39.9% fully vaxxed
- Nonmetro (87 counties): 4.8 million people, 43.2% fully vaxxed
- Nonmetro (567 counties): 19.3 million people, 41.2% fully vaxxed
- Nonmetro (408 counties): 9.5 million people, 40.2% fully vaxxed
- Nonmetro (211 counties): 3.8 million people, 40.9% fully vaxxed
- Nonmetro (414 counties): 5.0 million people, 41.6% fully vaxxed
As you can see, while the first two categories clearly have the highest vaccination levels, after that it jumps around within a range of 39.9% - 43.2% vaccinated. So yeah, it makes some difference...but not that much. Note that the range from the highest to lowest vaccination levels is only 10 points.
I stand by my contention that who you voted for in 2020 is the single clearest indicator of whether you've gotten vaccinated or not (or plan on doing so in the future).
Advertisement
