I go by FULLY vaccinated residents only (defined as 2 doses of the Pfizer or Moderna vaccine or one dose of the Johnson & Johnson vaccine).
I base my percentages on the total population, as opposed to adults only or those over 11 years old.
For most states + DC I use the daily data from the Centers for Disease Control, but there are some where the CDC is either missing county-level data entirely or where the CDC data is less than 90% complete at the county level. Therefore:
For California, I'm using the CDC data for most counties and the state health dept. dashboard data for the 8 small counties which the CDC isn't allowed to post data for.
Here's the weekly look at the rate of COVID-19 cases & deaths at the county level since the end of June, broken out by partisan lean (i.e, what percent of the vote Donald Trump received in 2020).
The case rate is pretty much the same as it was last week, with new cases running nearly 3x higher per capita in the reddest tenth of the country than the bluest tenth:
Here's the weekly look at the rate of COVID-19 cases & deaths at the county level since the end of June, broken out by partisan lean (i.e, what percent of the vote Donald Trump received in 2020).
The case rate is pretty much the same as it was last week, with new cases running nearly 3x higher per capita in the reddest tenth of the country than the bluest tenth...
I go by FULLY vaccinated residents only (defined as 2 doses of the Pfizer or Moderna vaccine or one dose of the Johnson & Johnson vaccine).
I base my percentages on the total population, as opposed to adults only or those over 11 years old.
For most states + DC I use the daily data from the Centers for Disease Control, but there are some where the CDC is either missing county-level data entirely or where the CDC data is less than 90% complete at the county level. Therefore:
For California, I'm using the CDC data for most counties and the state health dept. dashboard data for the 8 small counties which the CDC isn't allowed to post data for.
Here's the weekly look at the rate of COVID-19 cases & deaths at the county level since the end of June, broken out by partisan lean (i.e, what percent of the vote Donald Trump received in 2020).
The case rate is pretty much the same as it was last week, with new cases running 3x higher per capita in the reddest tenth of the country than the bluest tenth...
I go by FULLY vaccinated residents only (defined as 2 doses of the Pfizer or Moderna vaccine or one dose of the Johnson & Johnson vaccine).
I base my percentages on the total population, as opposed to adults only or those over 11 years old.
For most states + DC I use the daily data from the Centers for Disease Control, but there are some where the CDC is either missing county-level data entirely or where the CDC data is less than 90% complete at the county level. Therefore:
For California, I'm using the CDC data for most counties and the state health dept. dashboard data for the 8 small counties which the CDC isn't allowed to post data for.
Given how much I've been focusing on the red/blue divide when it comes to the COVID pandemic (both in terms of cases & deaths as well as vaccinations), I figured it'd be a good idea to take a look at the case and death rates based purely on vaccination rates instead.
The following graphs are up to date as of yesterday (10/12/21). Both measure the county-level case and death rates since the end of June compared against what percentage of the population is fully vaccinated (i.e., 2 doses of Pfizer/Moderna or 1 dose of Johnson & Johnson).
I've broken the population of the 50 states +DC (~331 million people...this doesn't include the U.S. territories) has been broken out into ten brackets of roughly 33.1 million apiece.
As you can see, case rates since June are 2.3x higher in the least-vaccinated tenth of the country (under 40.2% fully vaccinated) than in the most-vaccinated tenth (66.9% or higher):
I go by FULLY vaccinated residents only (defined as 2 doses of the Pfizer or Moderna vaccine or one dose of the Johnson & Johnson vaccine).
I base my percentages on the total population, as opposed to adults only or those over 11 years old.
For most states + DC I use the daily data from the Centers for Disease Control, but there are some where the CDC is either missing county-level data entirely or where the CDC data is less than 90% complete at the county level. Therefore:
For California, I'm using the CDC data for most counties and the state health dept. dashboard data for the 8 small counties which the CDC isn't allowed to post data for.
Methodology reminders, including some important updates:
I go by FULLY vaccinated residents only (defined as 2 doses of the Pfizer or Moderna vaccine or one dose of the Johnson & Johnson vaccine).
I base my percentages on the total population, as opposed to adults only or those over 11 years old.
For most states + DC I use the daily data from the Centers for Disease Control, but there are some where the CDC is either missing county-level data entirely or where the CDC data is less than 90% complete at the county level. Therefore:
For California, I'm using the CDC data for most counties and the state health dept. dashboard data for the 8 small counties which the CDC isn't allowed to post data for.
The 5 major U.S. territories don't vote for President in the general election, preventing me from displaying them in the main graph, but I have them listed down the right side.
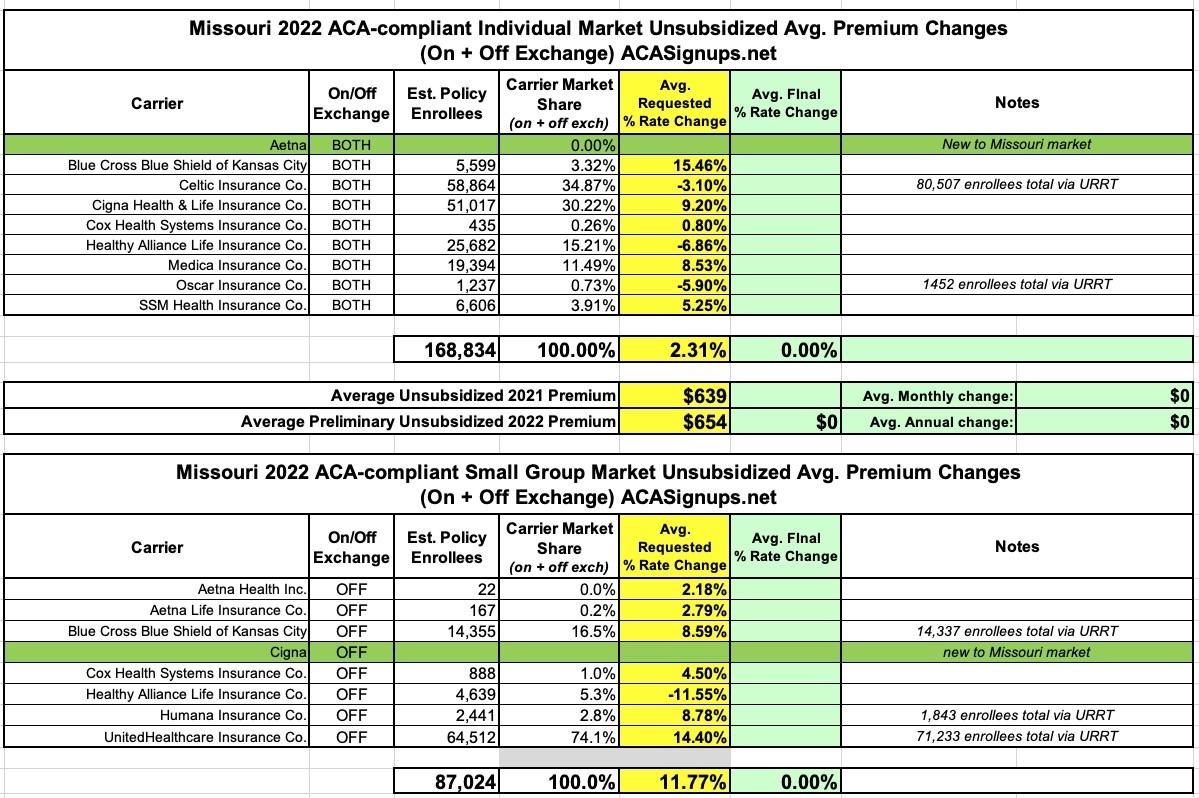
It's worth noting that each market has a new entrant for 2022: Aetna is joining the individual market while Cigna is jumping into the off-exchange Small Group market.
The differences in enrollment noted for some carriers is likely due to some product lines being discontinued--for instance, if Celtic drops premiums by 3.1% on most of their policies but discontinues some others entirely, those enrolled in the discontinued lines won't have any official rate change to their existing policies.