

Weekly Update: U.S. #COVID19 vaccination levels by COUNTY & Trump 2020 Vote
Tue, 11/02/2021 - 3:53pm
Methodology reminders:
- I go by FULLY vaccinated residents only (defined as 2 doses of the Pfizer or Moderna vaccine or one dose of the Johnson & Johnson vaccine).
- I base my percentages on the total population, as opposed to adults only or those over 11 years old.
- For most states + DC I use the daily data from the Centers for Disease Control, but there are some where the CDC is either missing county-level data entirely or where the CDC data is less than 90% complete at the county level. Therefore:
- For Hawaii, Illinois, Vermont, Virginia and West Virginia, I'm using data from the COVID Act Now Risk & Vaccine Tracker database.
- For Colorado, Georgia, Minnesota, New Mexico, North Carolina and Texas, I'm using their COVID vaccine dashboards set up by the state health departments.
- For California, I'm using the CDC data for most counties and the state health dept. dashboard data for the 8 small counties which the CDC isn't allowed to post data for.
- For Massachusetts, I'm using the CDC data for most counties but am now using the official Massachusetts Health Dept. weekly data report for Barnstable, Dukes & Nantucket counties, which the CDC only has partial data for.
- The 5 major U.S. territories don't vote for President in the general election, preventing me from displaying them in the main graph, but I have them listed down the right side.
- County populations are based on official 2020 U.S. Census Bureau data
- Alaska's 2020 election results are estimated thanks to an updated analysis by RRH Elections (all other states +DC have been using 2020 county-level election data all along).
With all this in mind, here's what things looked like as of November 2nd, 2021:
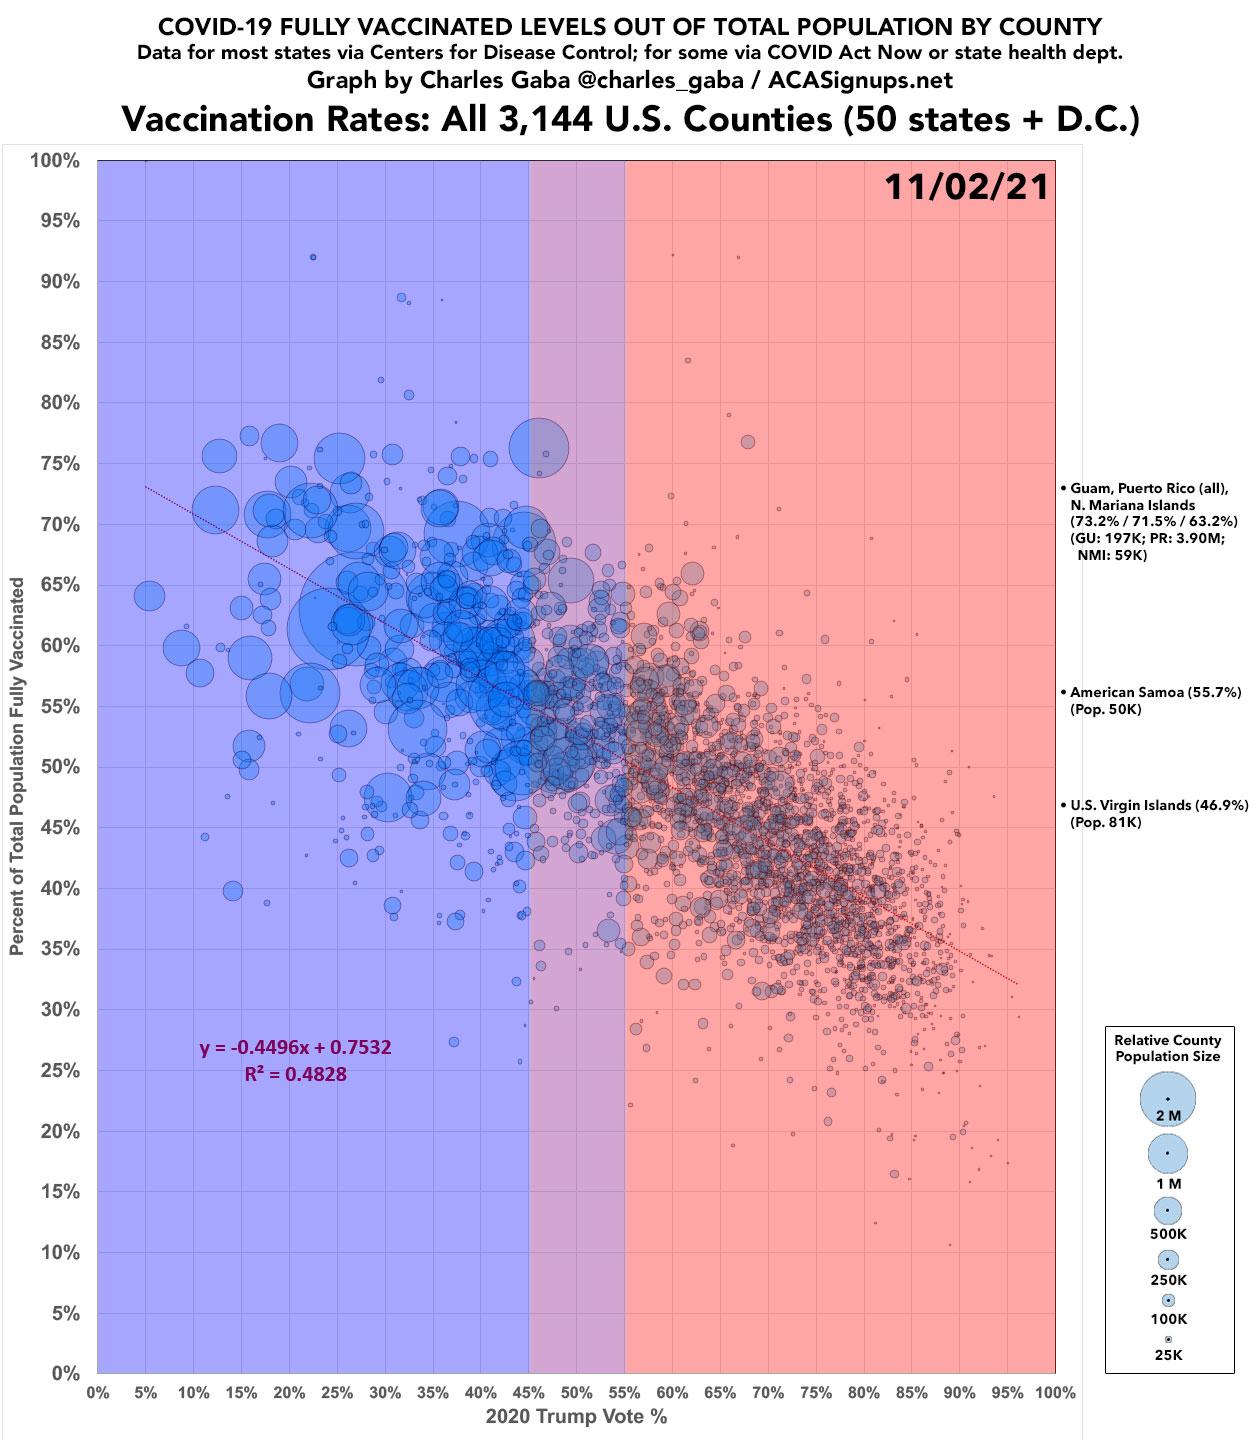
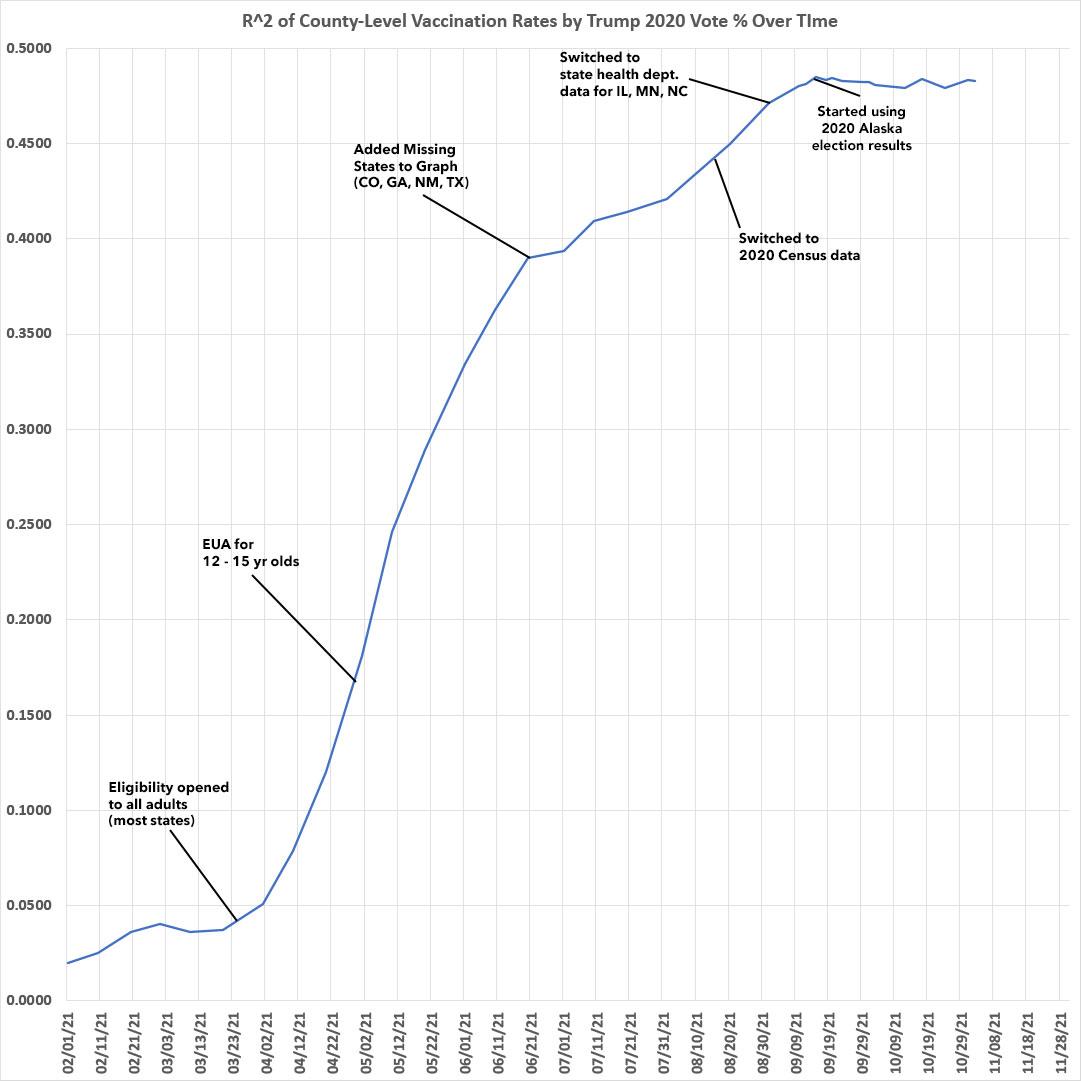
It's also important to note that after both the R2 (correlation) and slope formulas have pretty much plateaued over the past few weeks.
It'll be interesting to see what happens starting around Thanksgiving now that the FDA has given final approval to the Pfizer vaccine for 5-11 year olds (remember, I only track fully-vaccinated people, and the second Pfizer shot isn't given until 3 weeks after the first; assuming the first batch of younger kids starts getting their initial dose tomorrow (November 3rd), that means they should start getting their second dose around November 24th):
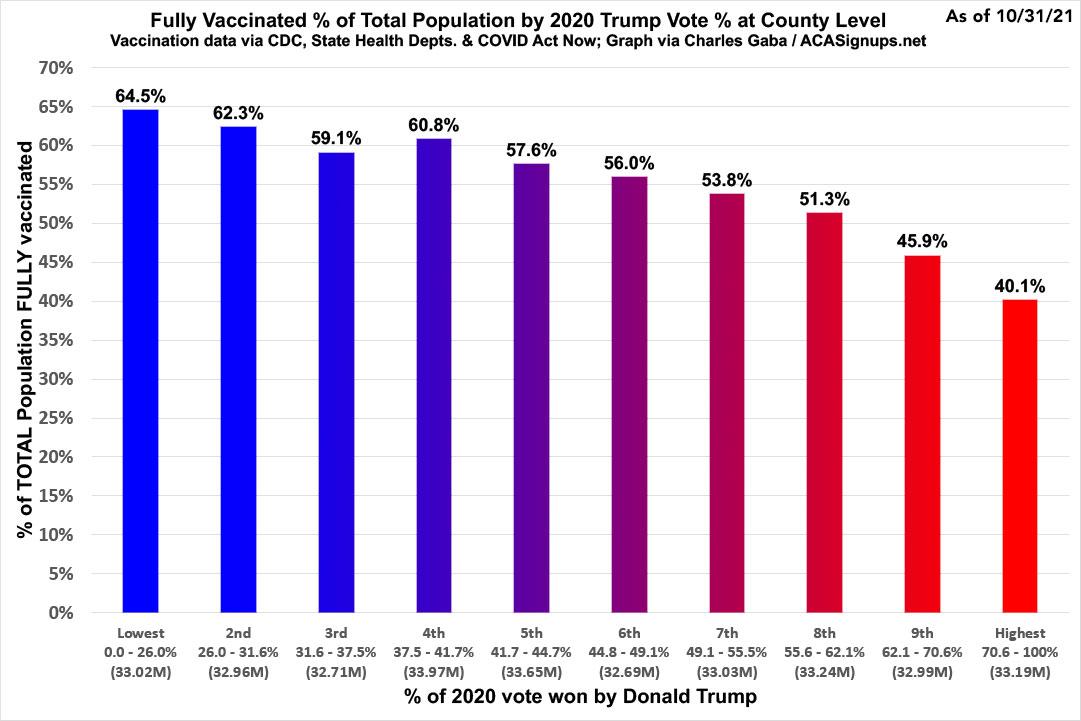
Here's what the data above looks like in bar graph format, broken out in rough deciles (tenths of the total population, or around 33.1 million people apiece). The vaccination rate in the bluest tenth of the nation is still running 61% higher than the reddest tenth:
Other things especially worth noting:
- Kalawao County, HI (pop. 82) is still the only one which is 100% vaccinated.
- There's four other counties which are over 90% fully vaccinated: Dukes and Nantucket, Massachusetts (pop. 20,600 & 14,255 respectively), Hudspeth County, Texas (pop. 2,912) and Bristol Bay, Alaska (pop. 844)
- The only other counties which have fully vaccinated at least 80% of their total populations are:
- Santa Cruz County, AZ (pop. 47,669)
- Presidio County, TX (pop. 6,131)
- San Juan County, CO (pop. 705)
- West Feliciana Parish, LA (pop. 15,310)
- Teton County, WY (pop. 23,331)
- Apache County, AZ (pop. 66,021)
- At the opposite end, there's 18 counties which have vaccinated less than 20% of their total populations:
- Slope County, ND (pop. 706)
- McPherson County, SD (pop. 2,411)
- McPherson County, NE (pop. 399)
- McCone County, MT (pop. 1,729)
- Holmes County, OH (pop. 44,223)
- Harding County, SD (pop. 1,311)
- King County, TX (pop. 265)
- Grant County, NE (pop. 611)
- Arthur County, NE (pop. 434)
- Storey County, NV (pop. 4,104)
- Billings County, ND (pop. 945)
- Garfield County, MT (pop. 1,173)
- McKenzie County, ND (pop. 14,704)
- Gaines County, TX (pop. 21,598)
- Powder River County, MT (pop. 1,694)
- Grant County, ND (pop. 2,301)
- Crowley County, CO (pop. 5,922)
- Winston County, AL (pop. 23,540)
Of counties with more than 100,000 residents, the top-vaxxed are Marin County, CA (77.3% vaxxed); Sumter County, FL (76.8%); and Montgomery County, MD (76.7% vaxxed).
Ironically, prior to the COVID pandemic, ultra-liberal Marin County (Trump only received 16% of the vote here) happened to be one of the birthplaces of the recent "anti-vaxx movement" resurgence, while deep red Sumter County (Trump received 68% of the vote) happens to be home to "The Villages", the massive retirement community where Trump held rallies last summer.
- Of counties with more than 100,000 residents, the least-vaxxed are Shelby and Limestone Counties, AL, both of which have less than 32% of their total populations....and possibly LaSalle County, Illinois (although this may be a data glitch).
- There are 49 counties with more than 1 million residents. Of those, the highest-vaxxed is Montgomery County, MD (76.7% vaxxed) while the lowest-vaxxed is Wayne County, MI (home of Detroit), which has only vaccinated 47.5% of its population.
Advertisement
