

A nonpartisan look at how effective vaccinations are
Wed, 10/13/2021 - 12:27pm
Given how much I've been focusing on the red/blue divide when it comes to the COVID pandemic (both in terms of cases & deaths as well as vaccinations), I figured it'd be a good idea to take a look at the case and death rates based purely on vaccination rates instead.
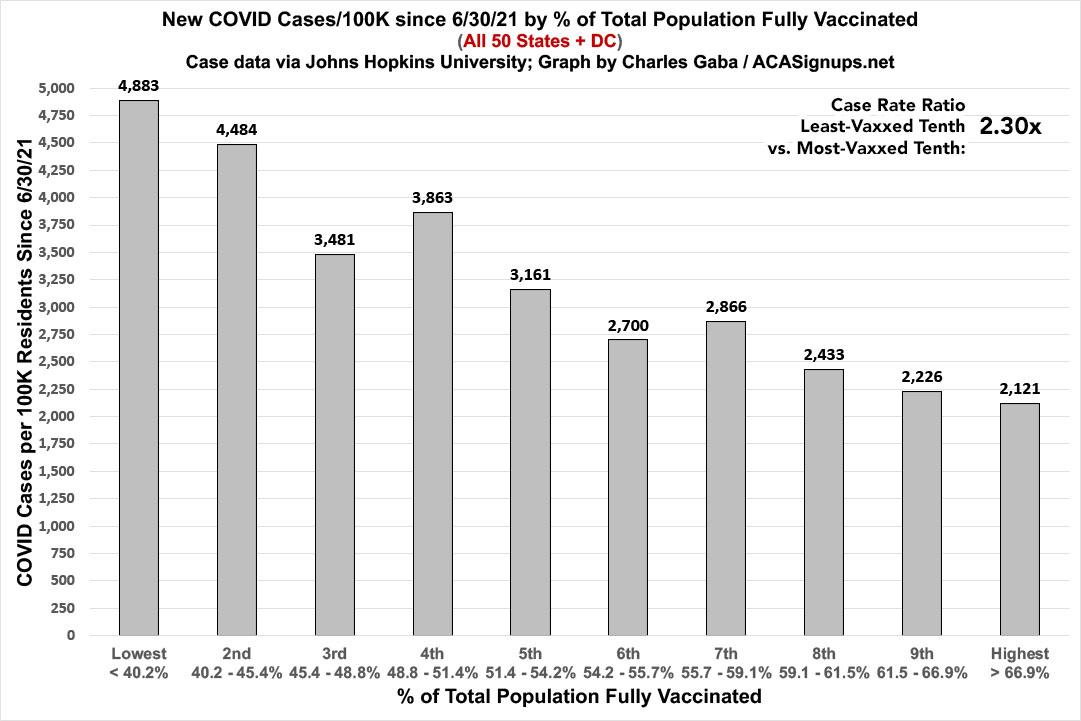
The following graphs are up to date as of yesterday (10/12/21). Both measure the county-level case and death rates since the end of June compared against what percentage of the population is fully vaccinated (i.e., 2 doses of Pfizer/Moderna or 1 dose of Johnson & Johnson).
I've broken the population of the 50 states +DC (~331 million people...this doesn't include the U.S. territories) has been broken out into ten brackets of roughly 33.1 million apiece.
As you can see, case rates since June are 2.3x higher in the least-vaccinated tenth of the country (under 40.2% fully vaccinated) than in the most-vaccinated tenth (66.9% or higher):
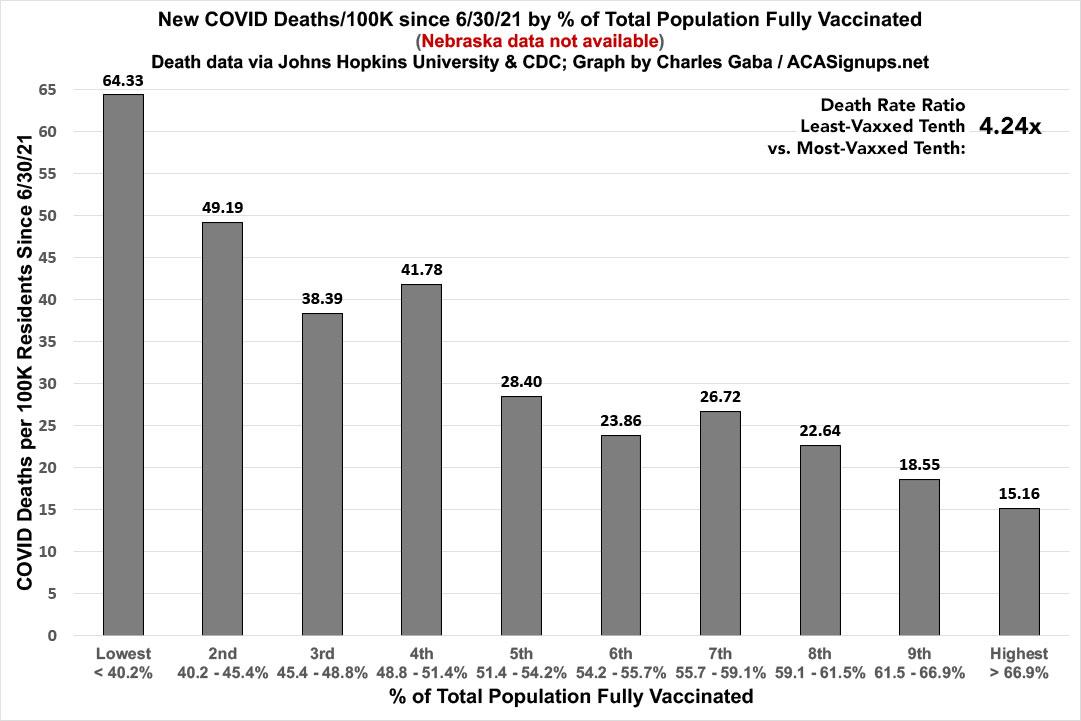
When you look at the death rates, the contrast is even more stark: Death rates in the least-vaxxed tenth are 4.24x higher than in the most-vaxxed tenth:
It will be fascinating to see how (or if) this pattern changes as time goes on, especially given the two newest factors: 3rd-shot boosters (which I'm not really tracking yet) and the pending approval of the Pfizer vaccine for 5 - 11 year old children.
Get vaccinated, dammit.
Advertisement
