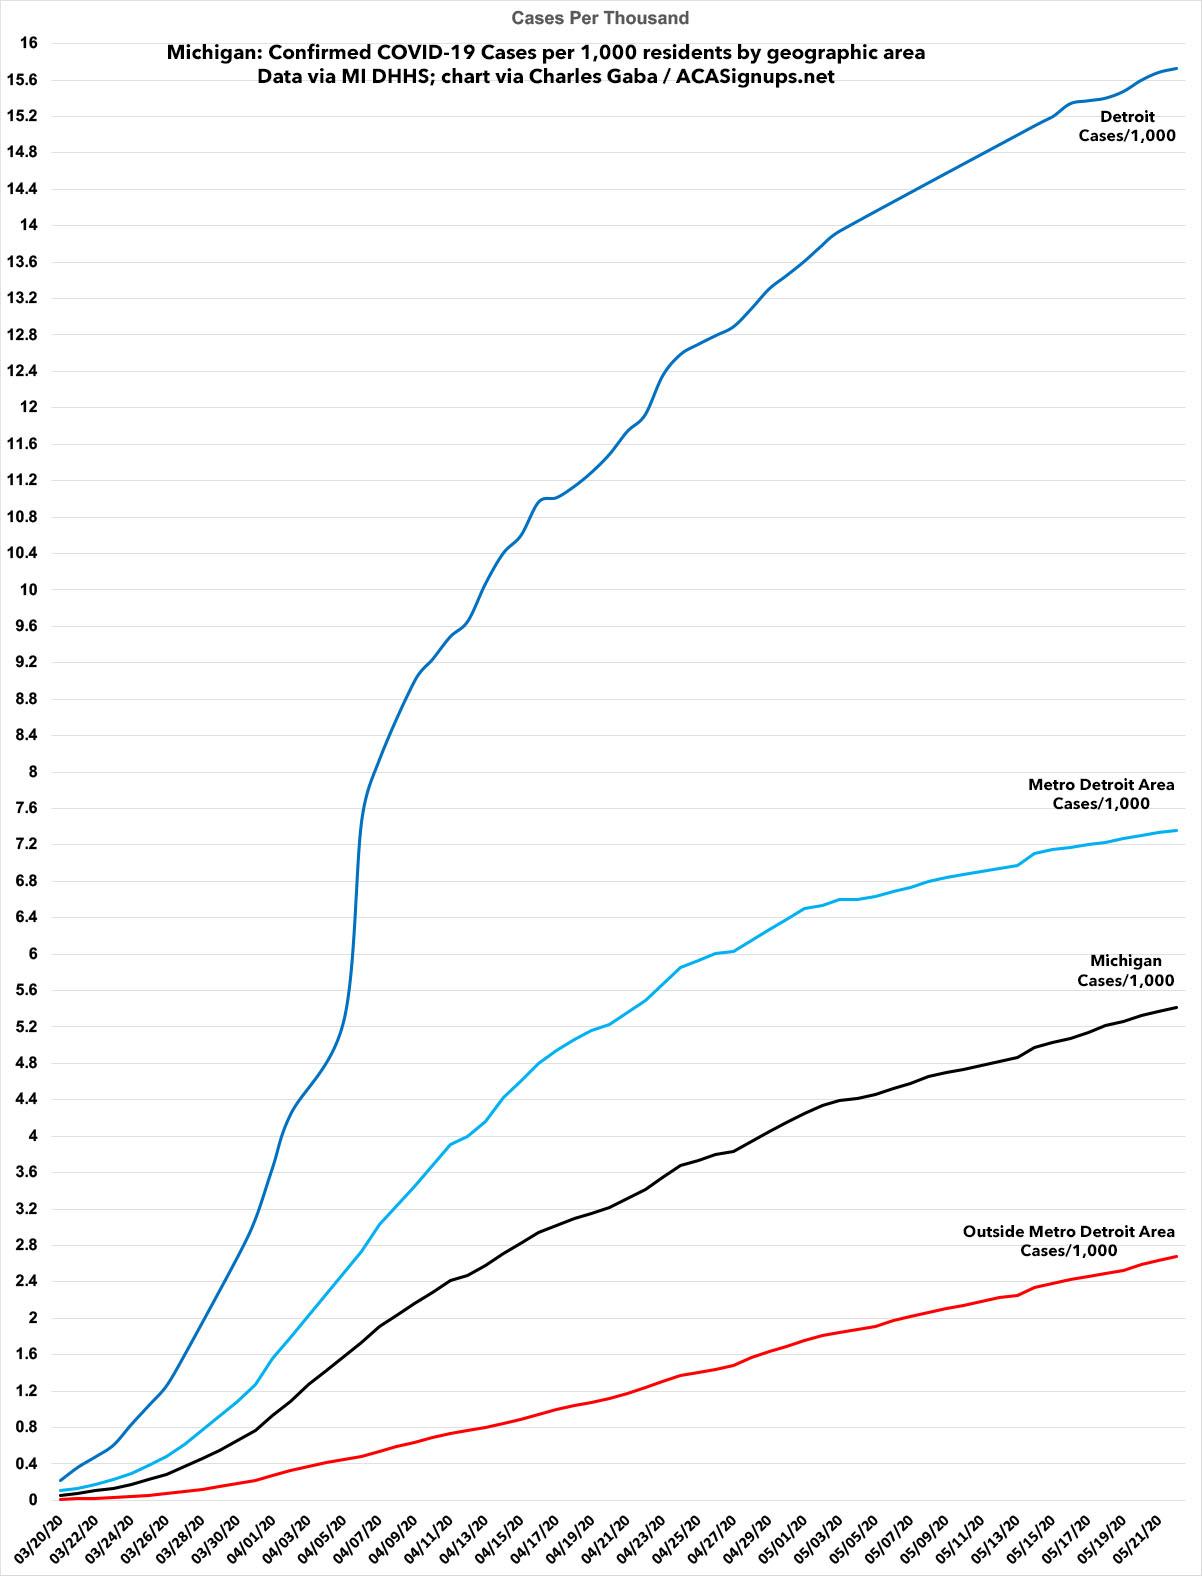
As a follow-up to my prior posts about the urban/rural divide of how COVID-19 has spread throughout Michigan, here's a graph which shows how it's spread in Detroit, the larger Metro Detroit area and the rest of the state on a per capita basis over time.
Obviously the probem is still far worse in Detroit and the Metro Detroit area overall...but the case trendlines are starting to flatten in Detroit and Metro Detroit, while it's still increasing at the same rate or higher in the rest of the state.
Massachusetts Health Connector continues extended enrollment as nearly 45,000 people enroll in new plans, update current coverage
April 28, 2020 – The Massachusetts Health Connector continues to help people who need health insurance after losing coverage or income due to the coronavirus, with a May 23 deadline ahead for June 1 coverage.
Since I've been neglecting other ACA/healthcare posts the past couple of weeks, I figured I should at least provide regular updates on why I've been mostly absent.
I've made major progress in updating and revising my breakout of COVID-19 cases and fatalities at not just the state level but the county level. Again, I've separates the states into two separate spreadsheets:
On May 21, 2020, the Health Connector announced in an Administrative Bulletin an extension to the extended enrollment period in response to the coronavirus (COVID-19) emergency through June 23, 2020 to assist uninsured Massachusetts residents seeking health coverage. (The extended enrollment period was previously set to end May 25.)
If you apply coverage under this special enrollment, the deadlines to complete enrollment are as follows:
Coverage Start DateEnrollment Deadline
Coverage Start Date: June 1st: Enrollment Deadline: May 23rd
Coverage Start Date: July 1st: Enrollment Deadline: June 23rd
Please note that if you are eligible to enroll due to normal special enrollment period rules, you can select the one that applies when you complete your application.
I've been spending a lot of time working on my county-level COVID-19 tracking project the past few weeks. I'm happy to report that I've managed to plug in the county-level case and fatality data for every thirteen states so far, so I figured this would be a good time to post a visual showing how the virus has spread over time across them in cases per capita (actually cases per thousand residents).
This is a much more useful measure than the raw number of cases since the population of each state (and county) varies so widely.
The states I've completed don't follow any particular pattern...aside from Michigan (which I started with because I live here, of course), the others are simply the states which I was able to get ahold of historic case/death toll data for from March 20th until today. Other states will follow as I complete backdating the data into the spreadsheets.
On April 14th, Covered California reported that 58,000 residents had enrolled in ACA exchange coverage during their COVID-19 Special Enrollment Period, of which roughly 20,000 did so via standard SEPs (losing coverage, moving, getting married/divorced, etc), while an additional 38,000 took advantage of the COVID-specific SEP.
I've made major progress in updating and revising my breakout of COVID-19 cases and fatalities at not just the state level but the county level, and should now be able to post updated summaries of the worst-hit counties on a weekly basis.
Due to the sheer volume of data involved, I've had to separate out the states into two separate spreadsheets:
All data below is up to date as of Saturday, May 16th, although due to variances in when different states report the data, some of the data may be from a day earlier. The counties are color-coded depending on whether they voted for Donald Trump (orange) or Hillary Clinton (blue) in 2016.
Believe it or not, even though Delaware is a fairly solidly blue state in Presidential elections, two of the three counties there (it's pretty small) voted for Donald Trump in 2016. Here's how the state's cases have shifted over time between New Castle County (the largest of the three, which voted for Clinton) and the other two counties which voted for Trump:
This is almost a complete reversal, with New Castle going from 2/3 of all cases at the beginning of April to just 1/3 today:
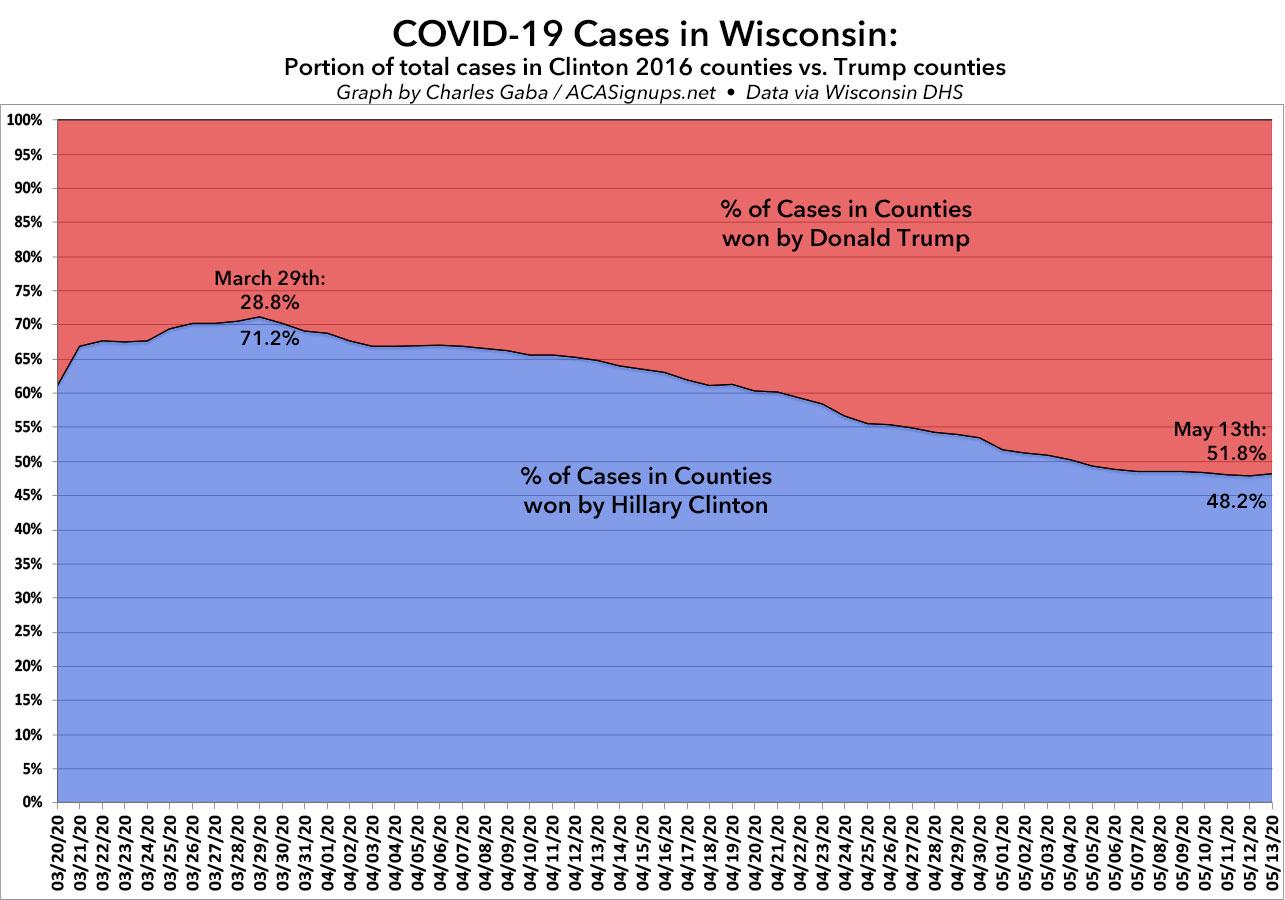
A few weeks ago, I posted a detailed analysis of how the COVID-19 virus has been spreading throughout Wisconsin. I noted that while the outbreak originally spread quickly in the more urban/blue-leaning areas, that has gradually changed over time, with the virus spreading to the rest of the state--including rural, conservative-leaning areas--at a faster rate while it slowed down in the urban areas.
It's time to check in to see whether that trend has continued...and sure enough, it has. Here's what this trend looks like visually:
A few weeks ago, I posted a detailed analysis of how the COVID-19 virus has been spreading throughout my home state of Michigan. I noted that while the outbreak originally spread quickly in Detroit and the more densely-populated Metropolitan Detroit region (Wayne, Oakland and Macomb counties), that has gradually changed over time, with the virus spreading to the rest of the state--including rural, conservative-leaning areas--at a faster rate while it slowed down in the urban areas.
It's time to check in to see whether that trend has continued...and sure enough, it has: