On the one hand, moving from 2,000 in the first 3 days to a minimum of 6,000 (likely more like 10K, since the 6K refers only to "accounts" not "people") in the first 17 days is a perfectly reasonable point for Washington to be at right now.
Today, the Exchange identified an error affecting 6,000 customer accounts enrolled in Qualified Health Plans. Early analysis indicates that our system integrator, Deloitte, ran an automated enrollment cancellation process in error. The affected accounts, which are a portion of the total number of customers who are enrolled in coverage starting on Jan. 1, 2015, experienced an erroneous cancellation of both their enrollment and payment for 2015 coverage.
Oops.
Well, on the plus side, the rest of the PR makes it clear that a) they're on top of it, b) it's gonna get resolved ASAP and c) it looks like this screw-up was Deloitte's fault, not the actual exchange itself (they call them out by name, which is noteworthy).
Colorado's first official enrollment report is simple, to the point, and includes not only new Medicaid/CHIP data after all (I was concerned that they'd stopped doing so, but apparently not), but also includes a handy 2015 vs. 2014 comparison chart, the SHOP number and even the number of QHP enrollees receiving tax credits/cost sharing!
In fact, the only gripes I have here are the lack of a new vs. renewal breakout (which it looked like they were going to include at first). They also don't include Medicaid/CHIP for 2014, but I already know that number went up 310K so far this year.
Regarding the King v Burwell ACA case which is headed to the Supreme Court soon (with a ruling likely sometime next summer, after the 2nd Open Enrollment Period is long behind us), Mitch McConnell had this to say this morning (h/t to Greg Sargent of the Washington Post for the story):
The moment, which was flagged by a Democrat, comes in an interview that McConnell gave to the Wall Street Journal’s Gerald Seib this morning (see second video). Seib notes that some Republicans have advocated for repeal, and asks: “How do you approach the Affordable Care Act now?” McConnell answers (emphasis added):
“It bears the president’s name. The chances of his signing a full repeal are pretty limited. There are parts of it that are extremely toxic with the American people. The elimination of the 40 hour work week. The individual mandate. The medical device tax. The health insurance tax. I think you could anticipate those kinds of things being voted on in the Senate. Such votes have not been allowed in the past.
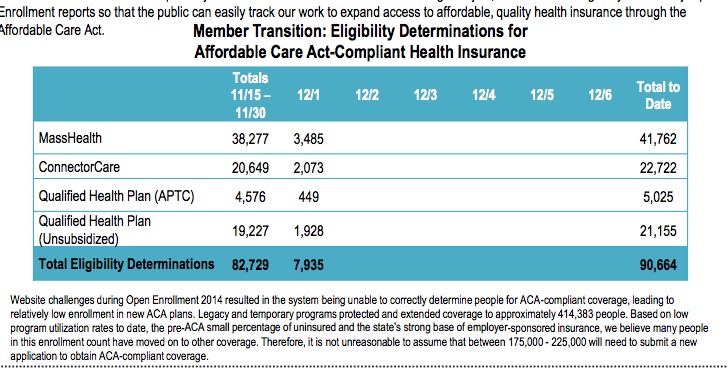
Based on yesterday's Massachusetts update, I'm knocking my "% selected of total determinations" down from an even 50% to 48.5% on any given day. Even so, 48.5% of 48,902 QHP determinations still means roughly 23,700, up nearly 2K on Monday.
As MA's 2014 OE total was only 31,695, this means the state is alread up to 75% of their 2014 total in the first 17 days of the 2015 period.
Put another way, at their current rate, MA is on track to enroll a minimum of 130,000 people for 2015...and that would be even without a December 15 or February 15 surge.
Meanwhile, MassHealth (Medicaid) enrollment continues to steam ahead, now standing at 41,762 people.
You need a subscription to read the full article, but this is a Good Thing. One of the big concerns with the 2015 Open Enrollment period has been whether the ACA exchanges are set up to let insurance companies know (quickly) when a current enrollee switches from them to someone else, to avoid double-billing. On the down side, this really should have been in place before OE2 started a couple of weeks back. On the plus side, it sounds like they're on top of it now, anyway, and they do still have a few weeks before the first premiums are due from either the old or new insurer anyway...
CMS TO Create 'Enrollee Switched List' For Federal Exchange Issuers
CMS announced in guidance Monday (Dec.3) that it will create an “Enrollee Switched List” that allows issuers participating in federally facilitated exchanges to identify enrollees who actively re-enrolled in coverage with another issuer.
If you take a look at The Graph this evening, you'll notice two small additions: First, now that the confirmed QHP selections are large enough to actually be visible, I've added them as a permanent feature (it'll be jaggy due to the staggered data release schedule of the various exchanges, especially HC.gov). Second, just for the hell of it, I've decided to add a rough projection for the point I expect total QHPs to hit the 2 million point: December 8th.
That would leave just 1 week to add a whopping 5 million people if my "7M by the 15th" projection is to also prove accurate. For comparison, last spring around 2 million people enrolled in the last 16 days of March (plus another 940K during the 15 day April "overtime" period), so it may sound insane to think that 5 million can be enrolled in just 1 week...and if it wasn't for the "autorenewal" factor, I'd agree.
However, I'm operating on the assumption that roughly 4 million current enrollees (in the 45 states which are set up for autorenewals) will simply do nothing whatsoever and automatically get renewed all in one shot on the 15th.
Today I've been informed that the renewal number reached 4,415 as of 11/23, plus another 3,588 new applications. It was also specified that an "application" represents a household, not the total number of covered lives for whatever policy is eventually enrolled in.
Assuming an average of 1.8 people per household, and further assuming that roughly 50% of those who apply had also already selected a plan as of the date in question (this has been a consistent rule of thumb based on the Massachusetts data to date), that suggests that those applications represent roughly 6,400 actual people, and roughly 3,200 of them should have already selected their plans. Knocking 100 off in the interest of caution gives roughly 3,100 new enrollments on top of the 4,415 confirmed renewals, or around 7,500 total enrollments as of the 23rd.
When I last estimated QHP enrollments for Massachusetts, I assumed roughly 50% of QHP determinations had been selected and thus figured they were up to roughly 19,200 as of the 27th. Today they posted their 2nd official weekly report, and it looks like I overshot a bit (the actual number through the 28th was 18,646). The good news is that the weekly report also includes three more days (through last night). When you tack on the weekend, the grand total now sits at 21,740. Divide that into the 44,446 QHP determinations and the ratio has dropped slightly, to 48.9%.
Still an impressive showing through the holiday weekend. For the record, MA has reached about 68% of their 2014 open enrollment total in just 15 days, and is on pace to reach at least 135K by 2/15 (though I still estimate they'll reach more than double that).
Meanwhile, Medicaid additions are now up to 38,283 to date:
WASHINGTON (AP) — Like other HealthCare.gov customers, immigrants are relieved that the government's health insurance website is working fairly well this year. They're baffled, though, by what looks like an obvious lapse: There is no clear way to upload a copy of their green card, the government identification document that shows they are legal U.S. residents and therefore entitled to benefits under President Barack Obama's health care law.
President Obama’s top health official said Monday the health care law will overcome a Supreme Court challenge that argues the administration is illegally doling out subsidies to about two-thirds of the states.