Last week I noted that with 41 states accounted for and the 2017 Open Enrollment Period quickly bearing down on everyone, it was time to pull the plug on my 2017 Average Rate Hike project and move on. I had come up with an overall national weighted unsubsidized average rate increase of around 25% for ACA-compliant individual market plans.
However, I also noted that I'd make sure to fill in the approved rates for the remaining 10 states as they came in, for completeness sake...and today, thanks to the HHS Dept. cutting the ribbon on 2017 Window Shopping at HealthCare.Gov, I've also been able to fill in the blanks for five of the remaining states all in one shot (the other five remain elusive).
More Than 70 Percent of Consumers Can Find Marketplace Plans for Less than $75 Per Month
With Start of Window Shopping, Americans Can Now Check Out Options for 2017 Coverage
With window shopping beginning today, Health Insurance Marketplace consumers can now visit HealthCare.gov to check out their options for 2017 coverage in advance of the start of Open Enrollment on November 1. A new report released today shows that 72 percent of Marketplace consumers in states using HealthCare.gov will be able to find plans with a premium of less than $75 per month and 77 percent will be able to find plans with premiums below $100, taking into account financial assistance. The report also shows that consumers will have options, with an average of 30 health insurance plans to choose from.
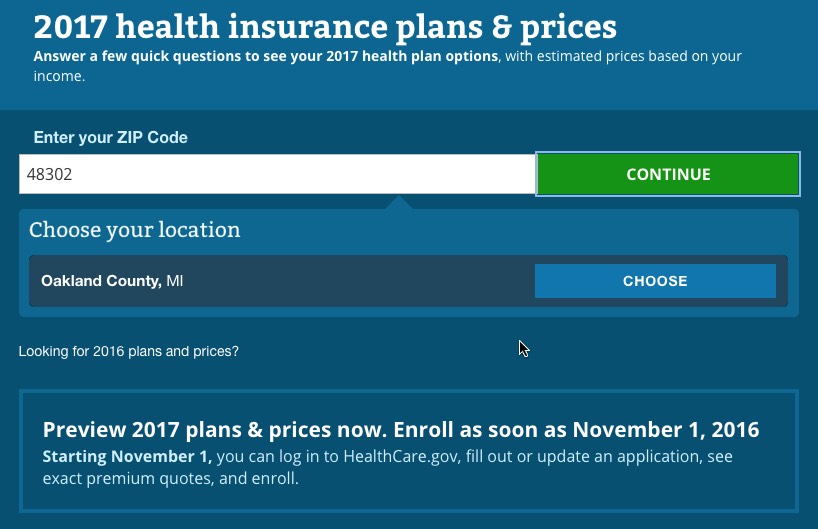
Let's step through the process and see what's changed, shall we?
First of all, the general interface is mostly the same but has a slightly different layout:
designed to be even more mobile-friendly (note the arrow at the top right...that toggles a vertical menu which lets you move back/forth between steps in the form process):
Consumers can expect at least two big changes this fall when they go shopping for their 2016 health insurance through the Massachusetts Health Connector: significantly fewer choices, and a new mechanism to find out which care networks include their doctors.
The Connector staff told the agency’s governing board Thursday that the number of plans offered next year will be no more than 81, down from the current 126.
The board had agreed in March that the Connector needed to simplify its offerings. The differences among the plans were described as too small to justify the confusion caused by so many options.
(judging from the Mervyn's ad campaign, white middle-class suburban women were the only ones who bought clothing in the '90's....)
With Open Enrollment 2017 just 11 days away and the books closed on my Average Rate Hike project (don't worry, I'll fill in the remaining 10 states later but with 41 states accounted for, I think I've made my point), I figured it'd be a good point to take a look at which of the ACA exchange websites are already open for 2017 window shopping and which ones aren't:
Yesterday, Kaiser published a completely updated version of their analysis. In addition to having more recent data to work with (including the increased number of ACA exchange enrollees, the increased number of people covered by Medicaid thanks to ongoing ACA expansion progress, etc), they also made some changes in their methodology. The most obvious change is that their estimate of the total uninsured (non-elderly only; you'd have to bump the number up by perhaps 1 million more if seniors were included) has dropped from 32.3 million to 27.2 million nationally.
In addition, however, the proportion of people falling into different categories has shifted as well. Here's how they break it out:
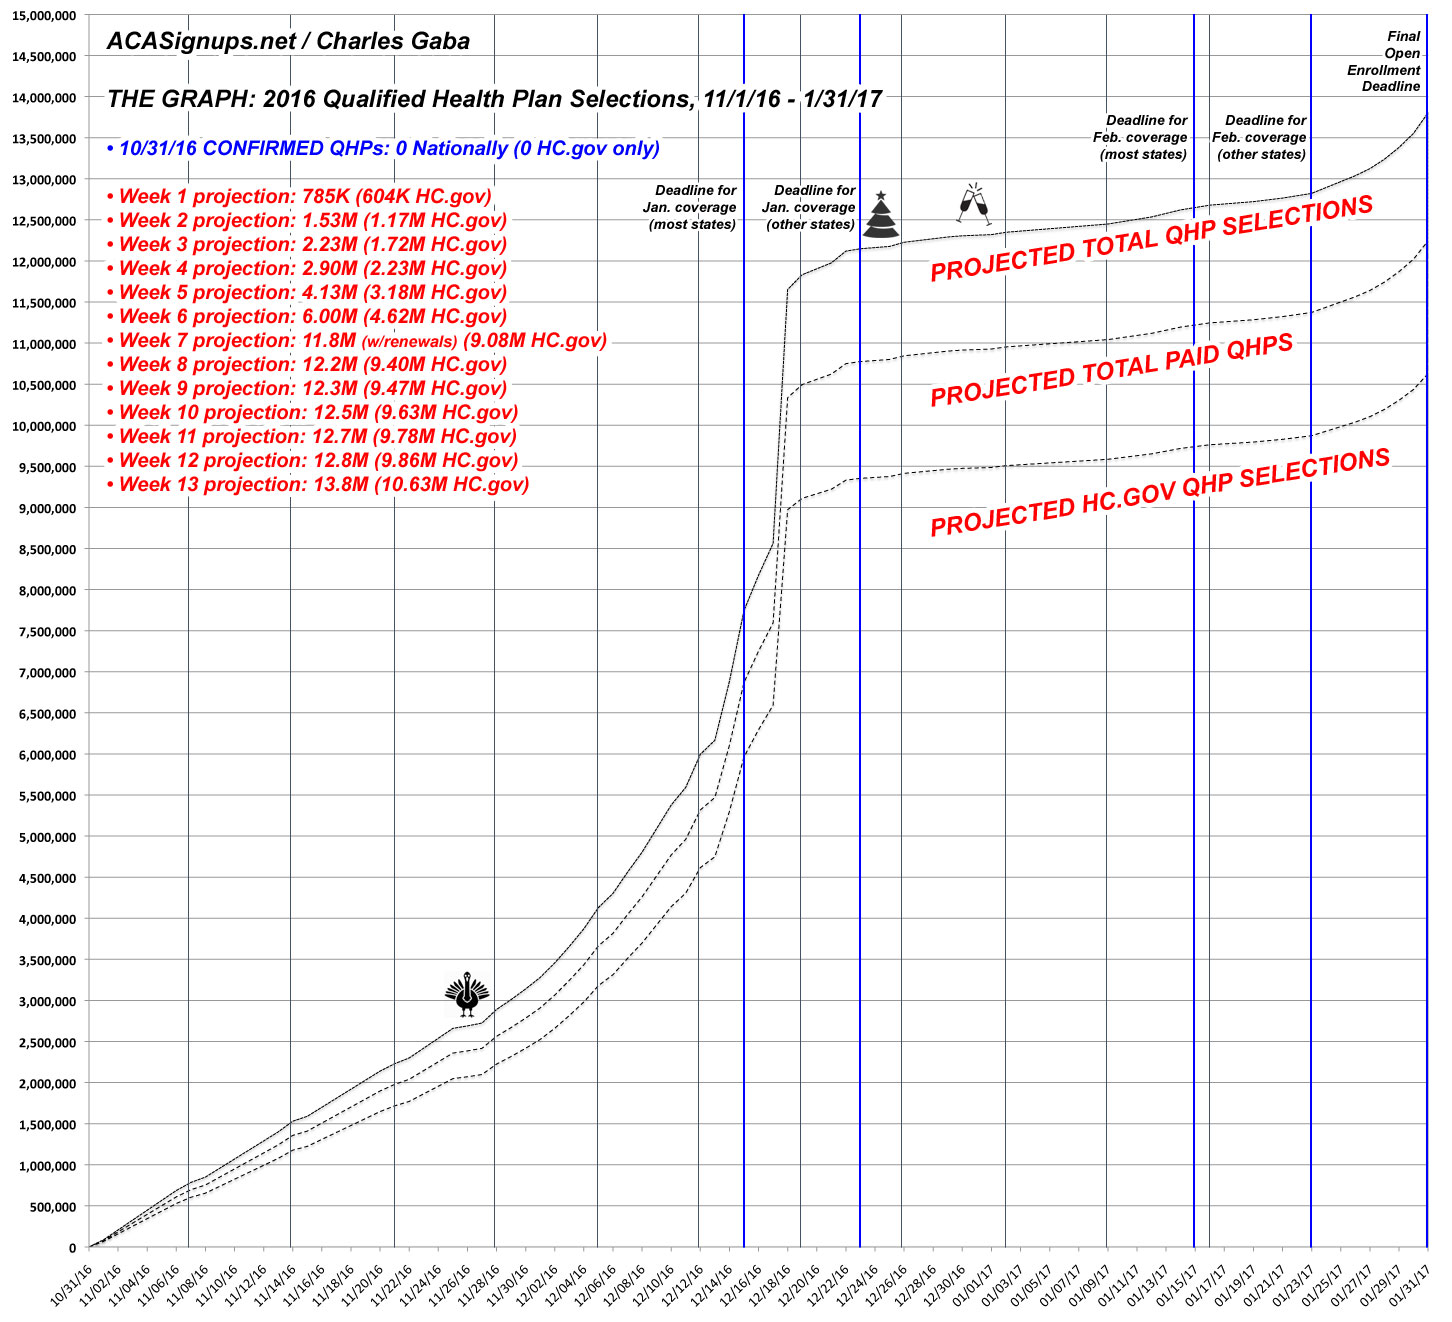
OK, now that both HHS and I agree that the ACA exchange target for the 2017 Open Enrollment Period is around 13.8 million QHP selections, it's time to dust off The Graph and reset it for 2017.
It was fairly easy to do so this time because this is the first year that the starting and ending dates match (November 1st to January 31st). All I really had to do was bump up the 1/31/17 projection from 12.7 million to 13.8 million, and the rest of the projection line adjusted accordingly.
With that in mind, here's how I expect things to play out for Year 4 (click below for a higher-res version):
Unfortunately, due to an ongoing side project of mine, I haven't had a chance to write up a full analysis/projection for OE4 as I usually do around this time.
However, I've been informed that the HHS Dept. plans on issuing their 2017 Open Enrollment projections in the near future, so I'm throwing this out there quickly:
I expect somewhere between 13.5 - 14.0 million people are likely to select QHPs via the ACA exchanges during the 2017 Open Enrollment Period (which runs from 11/01/16 - 1/31/17).
As always, it's important to remember that QHP selections are not the same as effectuated policies...there's usually around 10% or so of enrollees who never bother paying their first premium and thus are never actually enrolled, and of course there's attrition after that as people drop their policies after 1, 2, 3 months or more for various reasons (many replaced by new enrollees via SEPs and so forth).
UPDATE: Oh for heaven's sake. Turns out HHS is projecting 13.8 million...but no one will ever believe that my own expectations were around the same range because they announced it half an hour ago and I didn't notice.
Due to an ongoing external committment, I'm not able to write up a full analysis of this, but CMS has issued their "Mid-Year Effectuation Report" which updates at least some of the ACA exchange stats for the first half of 2016:
October 19, 2016
First Half of 2016 Effectuated Enrollment Snapshot
For the first half of 2016, an average of 10.4 million consumers had effectuated Health Insurance Marketplace coverage – which means those individuals, paid their premiums and had an active policy through one of the Health Insurance Marketplaces nationwide as of that date. [i] Effectuated enrollment is generally lower in January and February, since coverage purchased in the weeks before the final Open Enrollment deadline does not begin until March. June effectuated enrollment was slightly higher than the average for the first half of the year, about 10.5 million. These amounts do not include individuals enrolled in coverage through New York and Minnesota’s Basic Health Programs, which currently enroll about 650,000 people.


