

BOOM: White House & HHS announce 2.8 million additional ACA enrollees via the 2021 SEP & the #AmRescuePlan
Wed, 09/15/2021 - 10:30am
A little over a month ago, I made the following projection:
So, what does this mean for the final SEP push (again, it runs through 8/15 in most states)?
Well, it's hard to say, but I'd imagine it'll be a bit higher than the last week of July. That would mean something like ~220,000 more QHP selections via HC.gov states, and perhaps another 85,000 or so via the state-based exchanges (assuming they still make up roughly 28% of the national total). If so, that would put the final 8/15 tally at around 2.86 million new enrollees during the 2021 COVID SEP nationally (~2.05 million via HC.gov, ~808K via the SBMs).
Moments ago, via the HHS Dept (oddly, not via the Centers for Medicare & Medicaid (CMS), which usually publishes these enrollment reports):
Biden-Harris Administration Announces 2.8 Million People Gained Affordable Health Coverage During 2021 Special Enrollment
- 2.8 Million People Have Gained Affordable Health Coverage During the Special Enrollment Period
- American Rescue Plan Saved Existing Consumers a Total of $537 Million Per Month
A new report released today by the Department of Health and Human Services (HHS) shows that more than 2.8 million people newly gained access to affordable health care under the Biden-Harris Administration through the 2021 Special Enrollment Period (SEP) on HealthCare.gov and State-based Marketplaces.. With the gains made during the SEP, there are now a record-breaking 12.2 million people enrolled in the federal and state marketplaces. Additionally, there is historic enrollment today through Medicaid and the Children’s Health Insurance Program (CHIP) with over 82.3 million people relying on these programs as of April 2021.
The American Rescue Plan’s (ARP) expanded premium tax credits reduced premiums, increased savings, and provided consumers access to quality, affordable health care coverage through the Marketplaces:
- Over 90% of consumers who enrolled during the SEP saw their premiums reduced due to these tax credits.
- Existing consumers saved an average of $67 per consumer, per month, in premium savings.
- 48% of new HealthCare.gov consumers received a monthly premium of $10 or less after tax credits.
- The median deductible for new HealthCare.gov consumers fell by over 90%.
“There has never been a more critical time to ensure quality health coverage for all Americans.” said Health and Human Services Secretary Xavier Becerra. “Thanks to the Special Enrollment Period, we were able to help a record-breaking number of people across the country get covered, including those in rural and underserved communities. No one should have to lose their life savings to gain life-saving care.”
CMS also reports historic Medicaid and CHIP enrollment. The April 2021 Medicaid and CHIP Enrollment Trends Snapshot report shows that over 82.3 million individuals were enrolled in Medicaid and CHIP in April 2021, an increase of 580,591 individuals, compared to March 2021. Since February 2020, the month before the COVID-19 public health emergency was declared, enrollment in Medicaid and CHIP increased by more than 11.6 million individuals or 16.4%.
“It’s clear that when health coverage is accessible and affordable, people sign up. Peace of mind is especially needed during the COVID-19 pandemic and thanks to the Special Enrollment Period millions more can now rest easy knowing they are covered. The American Rescue Plan made health coverage more affordable than ever and CMS urges Congress to make those savings permanent,” said CMS Administrator Chiquita Brooks-LaSure. “If you didn’t sign up before August 15th, you should know there are still opportunities to enroll this year for those who experienced recent life events or have been impacted by Hurricane Ida. Apply today on HealthCare.Gov to find out if you can still enroll this year. The next Open Enrollment Period starts on November 1 for coverage in 2022.”
Consumers who still don’t have 2021 coverage can find out if they are eligible at healthcare.gov to enroll through SEPs that cover individuals who have experienced life-changing events, such as a loss of other coverage, marriage, having a baby, or moving to a new location. Throughout the year, consumers can also apply for Medicaid and CHIP coverage online in all 50 states and DC, and the majority of states complete real-time determinations and automated renewals.
According to the official SEP report, the exact number of new enrollees nationally during the 2021 SEP from 2/15/21 - 8/15/21 was 2,807,518, so I was off by 52,482 enrollees. From the breakout below, it looks like HC.gov enrollments were about 20,000 higher than I expected, while SBE enrollments were around 70,000 lower. Ah, well.
It's important to keep in mind that 2021 enrollment is still open as of this writing in several states:
Here's the state-by-state breakout from the report:

The report only lists the 2019 & 2020 SEP enrollment numbers for the 36 states hosted via HealthCare.Gov, but across those, SEP enrollment for the same time period was 2.8x higher than last year (when we were in the thick of the COVID pandemic but there was no COVID SEP in place via the federal exchange or the expanded ACA subsidies via the American Rescue Plan) and 3.7x higher than in 2019 (pre-COVID).
Other key points from the report:
- Demographic Trends: Due to the ARP expansion, HealthCare.gov consumers with a household income over 400% FPL represented a greater proportion of plan selections compared to the same period in past years, increasing from less than 2 percent in 2019 and 2020 to 7 percent in 2021. The 2021 SEP also attracted a more diverse group of consumers in HealthCare.gov states. Among consumers who attested to a race or ethnicity, 15 percent identified as African American, compared to 9 percent and 11 percent in 2019 and 2020, respectively. The percentage of consumers who self-reported as Hispanic/Latino increased to 19 percent, from 16 percent in 2019 and 2020.
- Geographic Trends: In several states that have not expanded Medicaid, there are counties with an average of at least 40 new plan selections per one thousand nonelderly residents--a notable contrast from HealthCare.gov states that have expanded Medicaid, where 96 percent of counties had 15 or fewer new plan selections per every one thousand nonelderly residents
- Nationwide, existing consumers with a new or updated plan selection after ARP implementation saved an average of $67 (or 50%) per consumer per month on premiums, totaling $537 million per month in savings. In twenty states and the District of Columbia, existing consumers saved over $75 per month, on average, due to the ARP APTC expansion.
- Nearly half of HealthCare.gov consumers with a new plan selection from February 15 to August 15 had a monthly premium of $10 or less, compared to 25 percent during the same period in 2020.
- Across the SBMs, 33 percent of consumers with a new plan selection had a monthly premium of $10 or less. Following implementation of ARP in the SBMs, consumers saw substantial premiums savings of approximately $95 per month
- The median deductible for new consumers selecting plans through HealthCare.gov between February 15 and August 15 decreased by more than 90 percent, from $750 in 2020 and 2019 to $50 in 2021. Over 40 percent of new consumers signing up during the 2021 SEP enrolled in plans that cover 94 percent of their expected health care costs (94% actuarial value), which the ARP made available to most consumers with an income between 100% and 150% of the Federal Poverty Level (FPL) for a $0 premium.
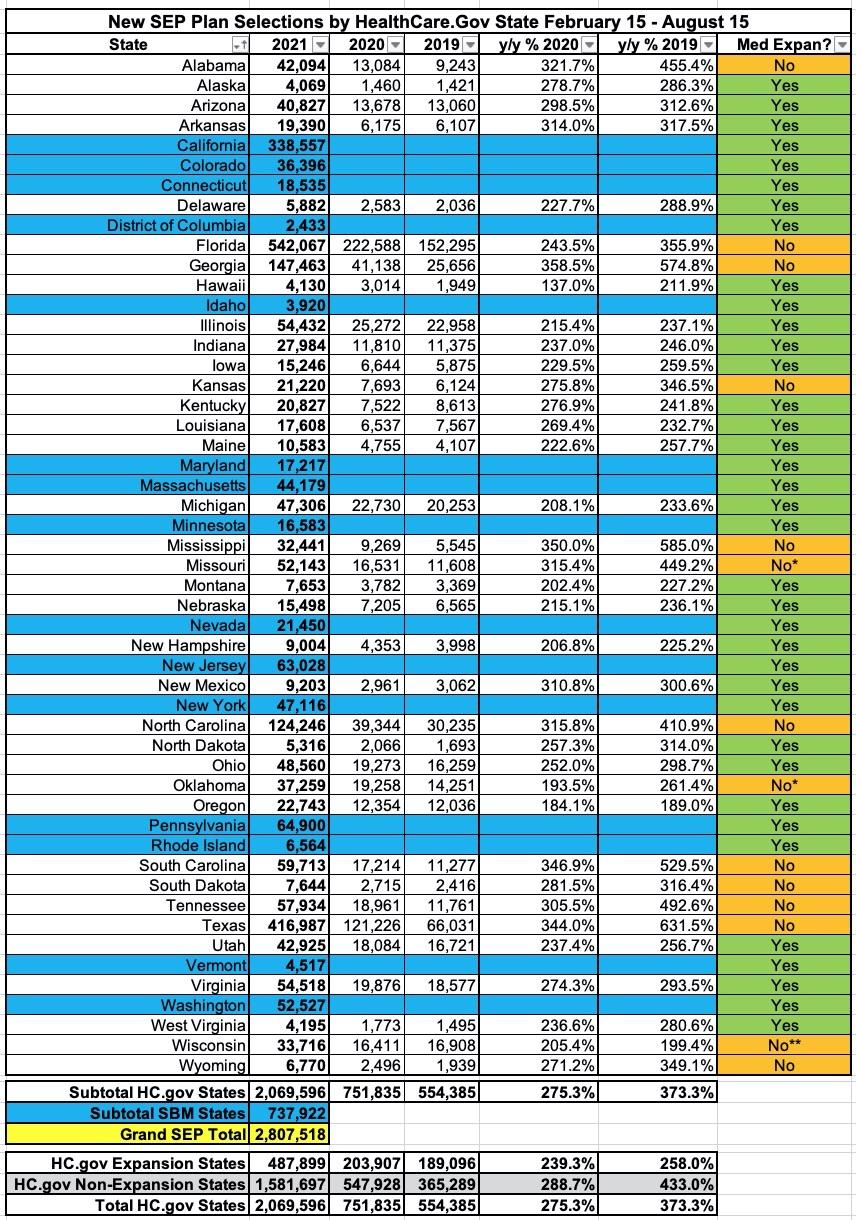
It's also important to note the enrollment discrepancy between states which have expanded Medicaid under the ACA and those which haven't. There's 12 non-expansion states, but for purposes of this data it's effectively 14 since Oklahoma didn't launch their Medicaid expansion program until July and Missouri's isn't launching until October.
While the 15 state-based exchanges can't be included in a year over year comparison, among the 36 HC.gov states, SEP enrollment increased by 2.6x over 2019 in expansion states...but was a whopping 4.3x higher in non-expansion states. This is due to the 100 - 138% "overlap" population which is eligible for heavily-subsidized ACA plans in non-exapnsion states but is transferred over to Medicaid in expansion states.
In fact, if you were to shift Oklahoma's status from "non-expansion" to "expansion" (their program started partway through the SEP itself), the other 13 non-expansion states would actually come out 4.4x higher.
There's a whole bunch of other demographic data in the report (breakouts of age, race, ethnicity, household income, etc.)...too much to include it all here, but there's a few which I think are of particular interest:
Table 6: Consumers Benefiting from the ARP UC Provision in HealthCare.gov States, July 1 – August 15, 2021
- Consumers with a Plan Selection who are Eligible for Additional APTC due to the ARP UC Provision: 208,622
- New Consumers: 84,246
- Existing Consumers: 124,376
- Consumers Not Eligible for any APTC without the ARP UC Provision: 34,134
Almost exactly 10% of all SEP enrollees via HealthCare.Gov states took advantage of the American Rescue Plan's Unemployment Benefit provision, which effectively offered a free #SecretPlatinum plan to anyone who received/receives unemployment benefits at any point in 2021. The report doesn't inclued the 15 state-based exchanges, but it's safe to assume the ratio is similar in those states as well.
One rather disappointing data point: Only around 34,000 people caught in the "Medicaid Gap" took advantage of the unemployment benefit provision. These are folks who earn less than 100% FPL and live in a state which hasn't expanded Medicaid. Since all 12 (14) of those states are also hosted via HealthCare.Gov, that means all non-expansion states are included here.
This is great news for those 34,134 people...but it's disappointing that so few unemployed folks in those states jumped on this opportunity. Granted, it didn't even go live until July, but my guess is that most Medicaid Gap folks never even knew about this option despite the $50 million marketing campaign the HHS Dept. implemented to get the word out about the Special Enrollment Period.
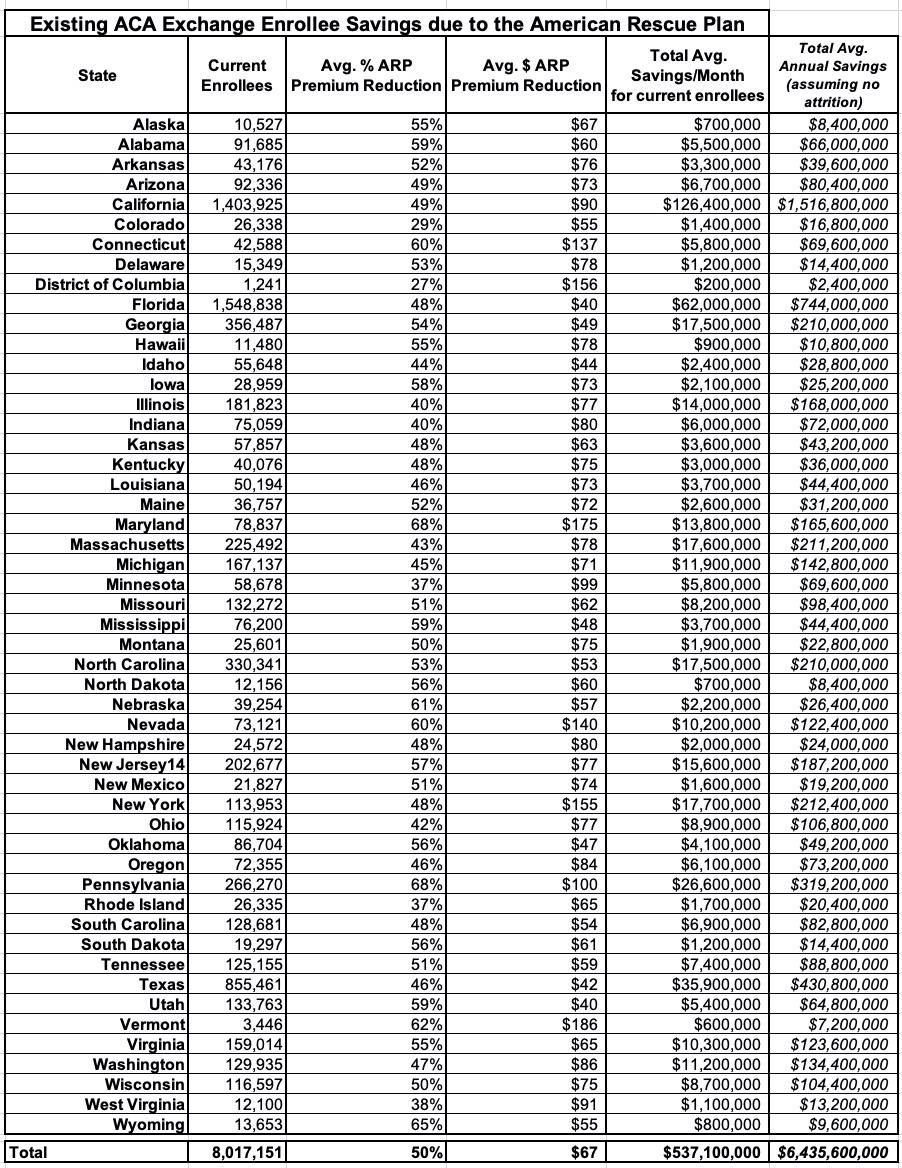
Table 7 details average monthly savings for existing consumers in all 50 states plus the District of Columbia, as well as aggregate monthly savings for consumers in each state due to the ARP. The total monthly aggregate savings for over 8 million existing consumers was $537 million with an average premium savings of $67 per consumer per month. Due to the ARP, most states saw substantial decreases in premiums after APTC. In 28 states, the average monthly premium reduction was 50 percent or more. In the District of Columbia and in twenty states (Arkansas, California, Connecticut, Delaware, Hawaii, Illinois, Indiana, Maryland, Massachusetts, Minnesota, Nevada, New Hampshire, New Jersey, New York, Ohio, Oregon, Pennsylvania, Vermont, Washington, and West Virginia) existing consumers saved, on average, over $75 per month due to the ARP expansion.
I've modified the table a bit to include the annual additional subsidies which current enrollees will receive for 2021 thanks to the American Rescue Plan (HC.gov states only). It's important to note that this is an estimate since it assumes that all ~8 million of them have been enrolled since January and stay enrolled for all 12 months of 2021, which is obviously unlikely, but it at least gives a baseline for figuring out how much of the ARP's expanded subsidies are going to existing ACA enrollees.
Assuming the 36 HC.gov states below are fairly proportional when the other 15 state-based exchanges are included in both enrollment and subsidy size, that means roughly $8.7 billion in ARP subsidies will go to provide extra savings to current enrollees for 2021. I point this out as a reminder of the stupidity surrounding the COBRA subsidy provision of the ARP last spring.
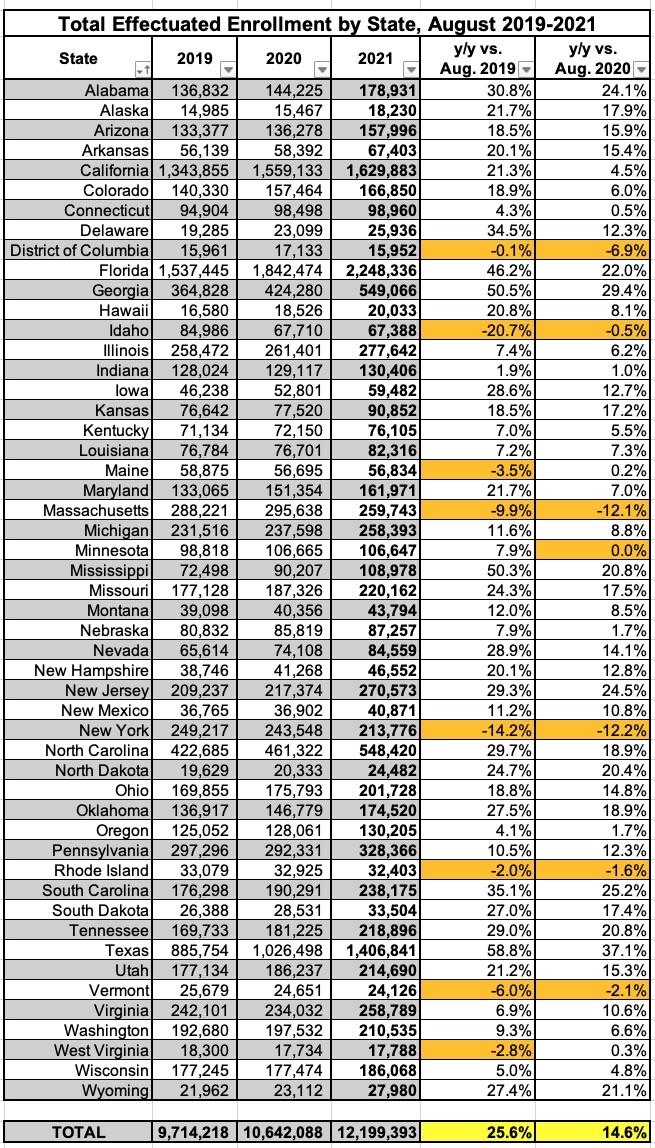
This is getting pretty long, so I'll write up posts about effectuated enrollment and the Medicaid/CHIP enrollment data separately, but in the meantime, here's the 12.2 million effectuated enrollee figure referred to above. Thanks to the SEP and the American Rescue Plan's expanded subsidies, effectuated ACA exchange enrollment as of August 2021 was over 25% higher than the same point in 2019 and nearly 15% higher than the same point in 2020:
Advertisement
