There's been a bunch of High Drama® within the House Republican caucus this morning as four "moderate" (aka, extremely vulnerable) Republicans have gone ahead and signed on to the Democrats discharge petition to force a House vote on a clean 3-year extension of the enhanced ACA tax credits.
The four who signed on are Brian Fitzpatrick, Rob Bresnahan, Ryan Mackenzie (all of PA) & Mike Lawler of NY (see thread here).
As of this writing, this development is also apparently causing a massive uproar, finger-pointing & backstabbing among House Republicans, with a lot of anger towards Speaker Mike Johnson, with at least one other vulnerable GOP member flat-out accusing him of lying, yadda yadda yadda.
What this actually means in terms of the enhanced subsidies, however, is a different story.
This is the best OEP ever for the ACA for several reasons:
The expanded/enhanced premium subsidies first introduced in 2021 via the American Rescue Plan, which make premiums more affordable for those who already qualified while expanding eligibility to millions who weren't previously eligible, are continuing through the end of 2025 via the Inflation Reduction Act;
A dozen states are either launching, continuing or expanding their own state-based subsidy programs to make ACA plans even more affordable for their enrollees;
100,000 or more DACA recipients are finally eligible to enroll in ACA exchange plans & receive financial assistance!
9/29/25: Welcome Paul Krugman subscribers! I greatly appreciate the shoutout by him but should add the following clarification:
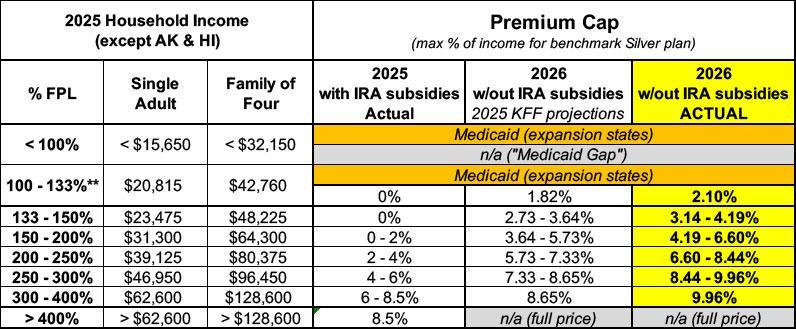
Regarding the chart below which he reposted comparing the original ACA subsidy scale to the current version: You probably think that if the enhanced subsidies expire it will revert back to the original version, which would be bad enough. In fact, however, the Trump Regime has also made THAT version even worse, like so:
HARTFORD, Conn. (December 16, 2025) — Access Health CT (AHCT), Connecticut’s official health insurance marketplace, experienced intermittent website outages on Monday, December 15, 2025 that impacted customers who wanted to enroll by that date to have coverage starting January 1, 2026. The website has been fully restored and is now available for eligible Connecticut residents to enroll in coverage.
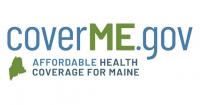
The Maine Department of Health and Human Services (DHHS) Office of the Health Insurance Marketplace (OHIM) will release biweekly updates on plan selections through CoverME.gov, Maine’s Health Insurance Marketplace.
Plan selections provide a snapshot of activity by new and returning consumers who have selected a plan for 2026. “Plan selections” become “enrollments” once consumers have paid their first monthly premium to begin coverage. These numbers are subject to change as consumers may modify or cancel plans after their initial selection.
The deadline to select a plan for coverage beginning January 1, 2026 is December 15, 2025. Consumers who select a plan between December 16, 2025 and January 15, 2026 will have coverage beginning February 1, 2026.
...Assuming new enrollment continues to only lag slightly behind last year, there could be up to ~4 million new enrollees for 2026, which means total plan selections could potentially hit ~25 million...which would actually break last year's record of 24.3 million.
If this happens (or anything close to it), you can expect the following scenario to play out:
Welp. In a development which should surprise absolutely no one, GOP House Speaker Mike Johnson has announced that the bipartisan "Fitzpatrick Bill" which would include a 2-year extension of the enhanced ACA tax credits (albeit with significant caveats) won't be included in their healthcare bill vote this week after all.
Speaker Mike Johnson confirmed Tuesday he will not allow a House vote this week to extend expiring Obamacare subsidies — a reversal from last week when a GOP leadership aide said the process “would allow” for an amendment vote.
“In the end, there was not an agreement,” Johnson told reporters, noting the divides in his conference over the subsidies.
We're now over the hump: The initial deadline for people to enroll in ACA healthcare coverage starting on January 1st has passed in most states.
HOWEVER, there's some important caveats to this, as well as some last-minute deadline extensions in a couple of states, so let's dig in...
If you live in IDAHO, last night was the one and only Open Enrollment Period deadline.
This means that if you didn't actively select a plan for 2026, current enrollees are stuck with whatever plan Your Health Idaho automatically renewed theme into, while uninsured residents who didn't sign up by the deadline are mostly out of luck.
The exceptions to this for both categories are a) if they're members of a federally-recognized Native American tribe (or are Alaska Natives); or b) if they are (or become) eligible for Medicaid or the Children's Health Insurance Program (CHIP). All of these are eligible to enroll year-round.
In my annual ACA Open Enrollment Guide, the first piece of advice is always to make sure you don't miss the deadline to enroll in healthcare coverage for the upcoming year.
I then list the various deadlines for people to get covered in each state, which is December 15th in most states for coverage starting January 1st (in a handful of states the deadline for January 1st coverage is as late as New Year's Eve).
I always include the caveat, though, that if you do miss that deadline, you still have an extra month or so (January 15th in most states) to enroll for coverage starting February 1st. This means that at worst, you'll have to "go bare" for the month of January (and pray you don't get sick or injured for those 31 days) before your coverage kicks in.