2026 Rate Change Project

SCROLL DOWN FOR UPDATES
Every year, I spend months painstakingly tracking every insurance carrier rate filing (nearly 400 for 2025!) for the following year to determine just how much average insurance policy premiums on the individual market are projected to increase or decrease.
Carriers tendency to jump in and out of the market, repeatedly revise their requests, and the confusing blizzard of actual filing forms sometimes make it next to impossible to find the specific data I need.
I really only need three pieces of information for each carrier:
- How many effectuated enrollees they had enrolled in ACA-compliant individual market policies as of early this year;
- What their average projected premium rate change is for those enrollees (assuming 100% of them renew their existing policies, of course); and...
- Ideally, a breakout of the reasons behind those rate changes, since there's usually more than one.
This year, the third bullet above has even more importance due to the almost certain expiration of the enhanced IRA subsidies. Most (possibly all?) insurance carriers have either been instructed to or are choosing to break out the portion of their requested rate changes which are specifically because of IRA subsidies expiring at the end of this year, which they in turn expect to cause a significant chunk of their healthier exchange enrollees to drop coverage, which in turn would make the remaining risk pool sicker/more expensive to treat.
Unfortunately, there are some states where, due to the carriers and/or the state insurance departments heavily redacting the rate filing documentation, I'm unable to fill in the actual number of people enrolled by some or all of the insurance carriers within that state's individual market. In those states the average premium rate changes listed (shown in grey) are unweighted averages, not weighted.
This can make a big difference.
- Let's say you have 2 carriers in a state, one raising rates by 10% and the other raising them by 1%. The unweighted average increase would be 5.5%.
- However, what if it turns out that the first carrier has 90% of the market share while the second only has 10%? That would mean a weighted average increase 9.1%.
- The unweighted average is the best I can do for these states without knowing the market share breakout, however.
In some of these states I've been able to acquire the actual effectuated enrollment for some carriers on the individual market but not all of them. In those cases I've been able to run partially-weighted averages:
- Let's suppose there are 4 carriers offering individual market policies in a state, but I only have the actual enrollment for the first two (30,000 and 120,000 respectively).
- Let's say the average rate changes for each carrier are +12%, +4%, +1% and -3%
- An unweighted average would be +3.5%, completely ignoring the enrollment numbers.
- Let's further say that according to the official CMS report, that state had 170,000 people enrolled in on-exchange policies as of February.
- If I assume 85% of their enrollees did so on exchange, that would put the total market at 200,000 people. It would also mean the other 2 carriers with unknown enrollment numbers had 50,000 between them. I'd then assume 25,000 apiece in order to run a semi-weighted average.
- This would give a semi-weighted average of +3.95%, rounded up to +4.0%.
This requires two big assumptions, however: First, that on-exchange enrollees make up 85% of the total; second, that the "missing" enrollees are evenly spread across the other two carriers. This isn't ideal, but it's still more accurate than just running a completely unweighted average.
With all of that in mind, use the DROP-DOWN MENU above to pick a state (as of this writing Vermont is the only state available).
UPDATE 6/5/25: I've plugged in the preliminary rate filings for 6 states so far. At full price, they're asking for a weighted average 15.6% rate hike next year (around $96/month), with nearly 1/3 of that being due specifically to the IRA subsidies expiring. That's an extra $28/month on average, or $330/year for unsubsidized enrollees.
UPDATE 6/19/25: I've plugged in preliminary rate filings for 10 states so far. At full price, assuming IRA subsidies expire and CSR reimbursement payments aren't reinstated, they're asking for a weighted average 18.5% rate hike next year (around $117/month), with around 4.5 points of that due specifically to IRA subsidies expiring. That's an extra $29/mo on average, or $349/year for unsubsidized enrollees.
UPDATE 7/18/25: I've plugged in preliminary 2026 rate filings for 16 states (+DC) so far. At full price, assuming IRA subsidies expire and CSR reimbursement payments aren't reinstated, individual market carriers in those states asking for a weighted average increase of 20.2% (around $124/mo), with roughly 5 points of that due specifically to the IRA subsidies expiring at the end of 2025.
That's an extra $31/mo on average, or $376/yr for unsubsidized enrollees, on top of the hundreds or thousands of dollars of lost subsidies.
UPDATE 7/21/25:
I've plugged in preliminary 2026 rate filings for 18 states (+DC) so far. At full price, assuming IRA subsidies expire and CSR reimbursement payments aren't reinstated, individual market carriers in those states asking for a weighted average increase of 20.2% (around $124/mo), with roughly 5.5 points of that due specifically to the IRA subsidies expiring at the end of 2025.
That's an extra $34/mo on average, or $410/yr for unsubsidized enrollees, on top of the hundreds or thousands of dollars of lost subsidies.
UPDATE 8/07/25:
I've plugged in preliminary 2026 rate filings for 31 states (+DC) so far.
At full price, assuming IRA subsidies expire, individual market carriers in those states asking for a weighted average increase of 21.6% (around $133/mo), with roughly 5 points of that due specifically to the IRA subsidies expiring at the end of 2025.
That's on top of the hundreds or thousands of dollars of lost subsidies for the ~92% of enrollees who are currently subsidized.
UPDATE 9/02/25: I've filled in the preliminary rate filings for all 50 states +DC as well as the final/approved rate filings for 15 states.
Overall, the weighted average rate increase for unsubsidized enrollees is 23.4% nationally, which is the highest year-over-year gross rate hike since the ACA overhauled the individual market starting in 2014.
The national average will move up or down slightly as more states finalize their 2026 premium changes, but I'd still expect the final average to end up somewhere between 22 - 24%.
At the state level, the rate changes range from a slight decrease in Alaska (-0.2%) to a whopping 36.8% avg. rate increase in Mississippi.
In raw dollars, it ranges from a $3/mo reduction in Alaska to an additional $235/month in New Mexico. However, this doesn't necessarily mean much to the enrollees, since Alaska's full-price premiums already average $1,102/month to begin with, while New Mexico announced that they're backfilling 100% of the federal subsidies which will be lost when the IRA upgrade expires at the end of this year along with their own state-based supplemental subsidies.
UPDATE 10/03/25: I've filled in the preliminary rate filings for all 50 states +DC as well as the final/approved rate filings for 28 states.
Overall, the weighted average rate increase for unsubsidized enrollees is 23.7% nationally, which are the highest year-over-year gross rate hikes since the ACA overhauled the individual market starting in 2014.
The national average will move up or down slightly as more states finalize their 2026 premium changes, but I still expect the final average to end up somewhere between 22 - 24%.
At the state level, the rate changes range from a slight decrease in Alaska (-0.2%) to a whopping 36.8% avg. rate increase in Mississippi.
UPDATE 10/03/25: I've filled in the preliminary rate filings for all 50 states +DC as well as the final/approved rate filings for 30 states +DC.
Overall, the weighted average rate increase for unsubsidized enrollees is 23.6% nationally, which are the highest year-over-year gross rate hikes since the ACA overhauled the individual market starting in 2014.
The national average will move up or down slightly as more states finalize their 2026 premium changes, but I still expect the final average to end up somewhere between 22 - 24%.
At the state level, the rate changes range from a slight decrease in Alaska (-0.2%) to a whopping 46.3% avg. rate increase in Arizona.
UPDATE 10/20/25: We're now up to 35 states +DC & 25% on avg nationally.
At the state level, the rate changes range from a slight decrease in Alaska (-0.2%) to a whopping 46.3% avg. rate increase in Arizona.
UPDATE 10/28/25: We're now up to 39 states +DC & 25% on avg. nationally.
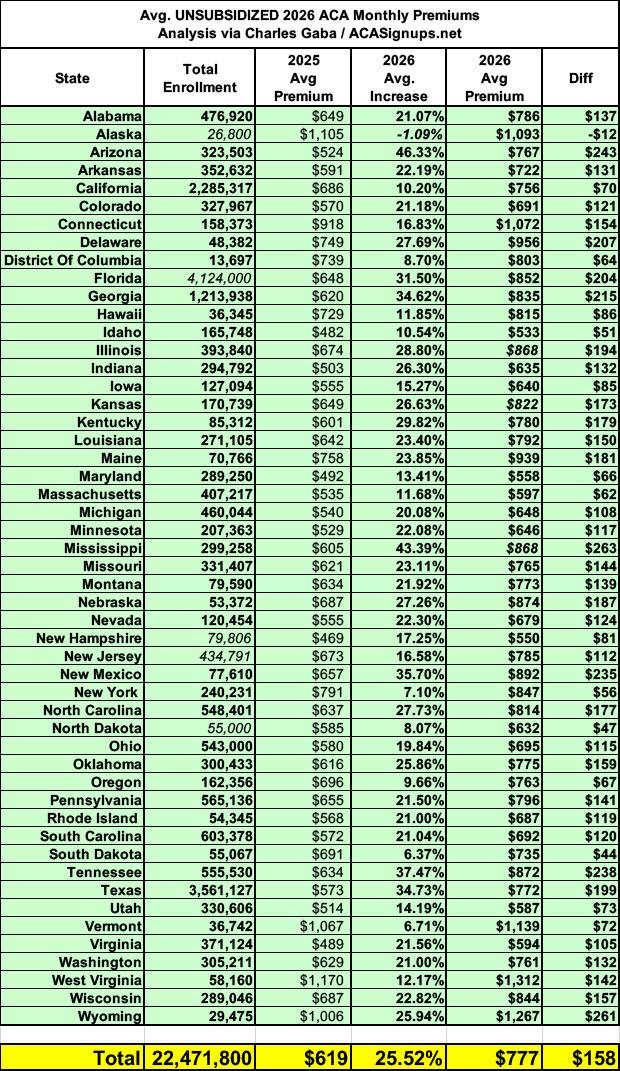
UPDATE 11/02/25: Annnnd that's that: With the final, approved rate filing decisions for the remaining states, here's what unsubsidized 2026 ACA individual market premiums look like for all 50 states +DC: +25.5% on average...the highest year-over-year gross rate hikes since the ACA exchanges launched in 2014.
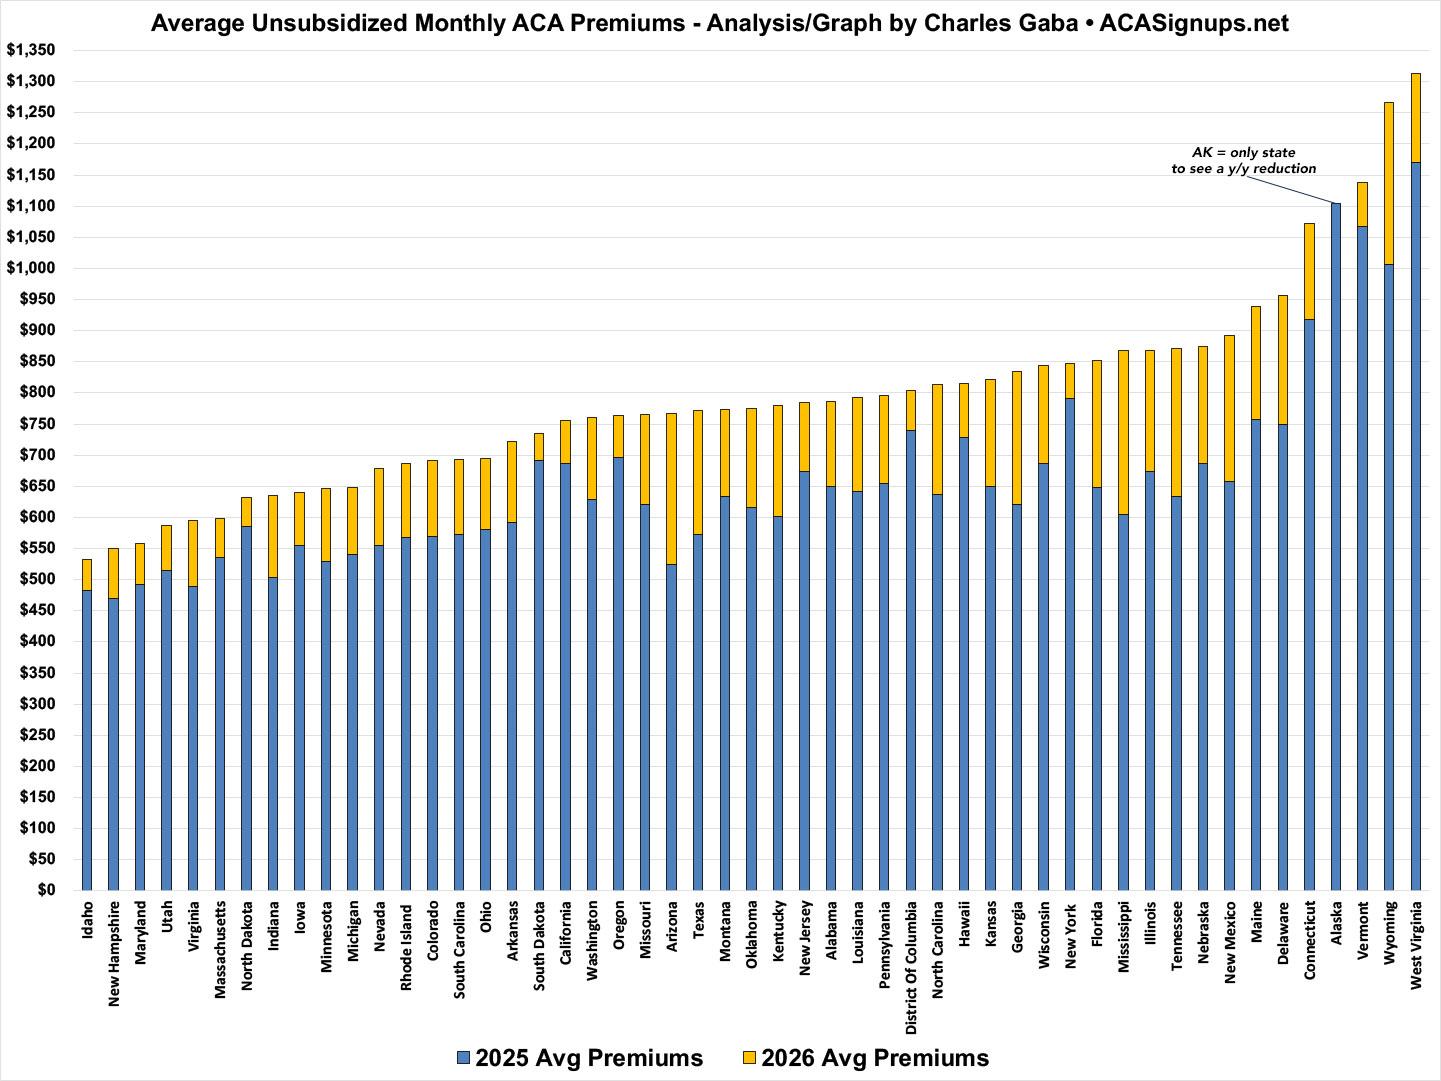
Here's what it looks like visually, sorted from lowest to highest average 2026 gross monthly premium:
How to support my healthcare wonkery:
1. Donate via ActBlue or PayPal
2. Subscribe via Substack.
3. Subscribe via Patreon.


