Every month I post an entry about the official CMS Medicaid enrollment report, documenting the increase in Medicaid enrollment since ACA expansion went into effect. The numbers were increasing dramatically every month for nearly two years, but started slowing down last fall as most of the expansion states started maxing out on their eligible enrollees.
I'm taking a break from the national panic over Trump's election to announce two subtle but important modifications to The Graph:
First: In yesterday's release of CMS's Weekly Snapshot Report from HealthCare.Gov for the first "2 weeks" of open enrollment, they explained that instead of running the weeks from Tuesday - Monday, they're going to measure them by the traditional calendar week (Sunday - Saturday). This means that the first two "weeks" are being cut off by 2 days (Nov. 1st - 12th instead of the 14th).
Since all of the official reports going forward will be measured Sunday - Saturday, I've changed the graph to match. I've also modified my official Weekly Projections accordingly. It's important to clarify that the actual projections haven't changed at all, just the cut-off date (for instance, I originally projected 1.53 million people in the first 2 weeks (14 days); instead I now have it as 1.29 million in the first "2 weeks" (12 days). The actual projection itself hasn't changed at all.
Yesterday, the Access Health CT board meeting presentation gave the 2017 QHP selection tally as (I think) 9,455 renewals plus 6,630 new additions for a total of 16,085 people, though it's a little confusingly presented.
They don't really break out the "renewal" number, so I'm not certain what the total is, but assuming the 9,455 figure is accurate, that brings it up to 16,498, or 970/day.
For comparison, last year they only averaged around 575/day (for the first 7 days anyway), so it's definitely busier (2.3x faster) so far.
Even just looking at new enrollees: The first week averaged 183/day last year; this year it was 368/day the first 8 days and 425/day the first 17 days...again, more than twice last year's rate so far.
Total effectuated QHP enrollment as of September 2016: 166,098 people...or about 5% higher than they had in March, according to the official CMS report. This is unusual; almost every other state has seen a substantial drop-off in effectuated enrollment. The only other state which constantly increases effectuations during the off-season is Massachusetts, and that's mainly because they have special "ConnectorCare" policies which are available year-round to anyone. On the other hand, according to the WA exchange report, there has been a slight net drop since March...of around 4.5% (see 2nd slide below). Not sure what to make of that. Either way, however, the point is that attrition is unusually low compared to other states.
Individuals have selected health care plans as of November 15, 2016. This enrollment reflects a period in which Covered California did not conduct media or enrollment promotion until after November 12th .
Compares to approximately 50,700 for same period 2015 (when Covered California had conducted extensive media and “bus tour” efforts to promote enrollment).
OK, so new enrollments are down about 11% from last year, but as they note, they deliberately held off on actively promoting/advertising until after the election this year.
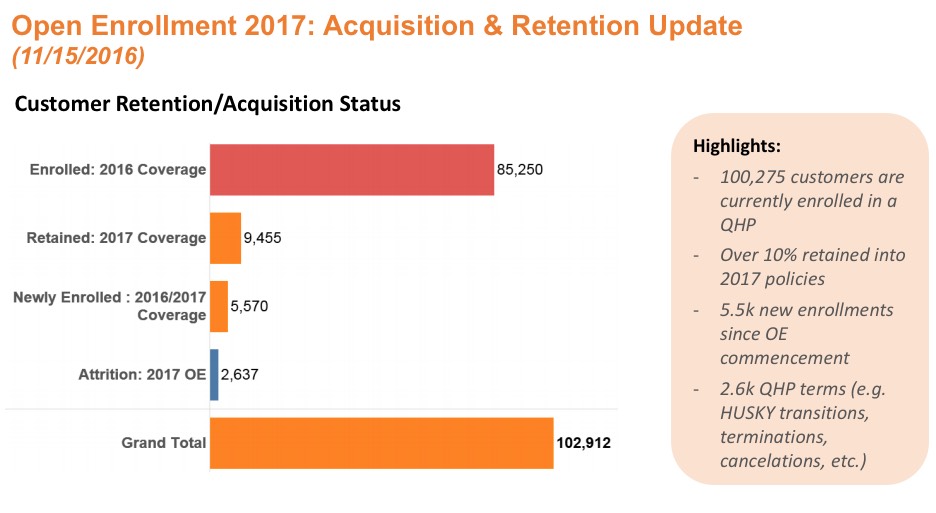
If I'm reading this correctly, it looks like they currently have 85,250 people enrolled in effectuated exchange policies. 9,455 have actively renewed/re-enrolled into either their existing policy or a different one, plus another 5,570 brand-new enrollees who have signed up, for a total of 15,025 QHP selections for 2017.
What's confusing me is that they also say that "100,275 are currently enrolled"...which you only get by adding all 3 of those numbers together, which makes little sense to me.
With 23,883 people signing up via MNsure for private coverage as of Nov. 13, the exchange is more than one-fourth of the way to its budget target of 83,000 enrollees at the beginning of next year.
That's 1,837 per day, vs. last year's 404 per day; while things are starting to slow down, they're still enrolling people at a rate 4.5x as fast for the moment. Again, this is mainly due to MNsure's unique first-come, first-serve enrollment cap on most of their carriers.
A proposal to expand a federal health insurance program for needy people could be off the table following the results of Tuesday's election.
The victory of Republican Donald Trump, who has called for a repeal of Obamacare, along with the increasingly conservative Republican make-up of the South Dakota state Legislature could thwart Gov. Dennis Daugaard's efforts to expand Medicaid in the state.
Daugaard for more than a year has worked with the Obama administration and the Indian Health Service to strike a deal, which stemmed the approval of a federal policy that allows the state to spend less on Medicaid-eligible Native Americans. And part of that bargain has been staked on South Dakota using the savings to cover an additional 50,000 South Dakotans under Medicaid.
Trump hasn't set a clear policy position on Medicaid expansion but has said he'd repeal the Affordable Care Act, though two of his closest allies, New Jersey Gov. Chris Christie and Indiana Gov. Mike Pence, have accepted Medicaid expansion.
Burwell's Tweet doesn't give the cumulative total to date, but her "best day yet" clarifier certainly helps. My pre-election model was projecting the following:
11/01: 68K
11/02: 92K (160K total)
11/03: 92K (252K total)
11/04: 92K (344K total)
11/05: 75K (419K total)
11/06: 51K (470K total)
11/07: 92K (562K total)
11/08: 92K (654K total)
11/09: 85K (739K total)
I then went on to note that the actual tally for 11/09 specifically (the day after the election) turned out to be "over 100,000"...later clarified as 105,000 people, which is 24% higher than my own one-day projection.
My projections for the next few days were around 85,000 per day, for a cumulative total of 993,300 QHP selections via HealthCare.Gov as of November 12th.
Today CMS issued their first bi-weekly "snapshot" report. Lo and behold:
Biweekly Enrollment Snapshot • WEEKS 1 AND 2, NOV 1 - 12, 2016


