

Week 1 & 2 Snapshot: 1.0 million HC.gov enrollments (1.5% higher than my projection)
Wed, 11/16/2016 - 11:04am
Last week, regarding enrollments via the federal exchange at HealthCare.Gov, I noted:
Burwell's Tweet doesn't give the cumulative total to date, but her "best day yet" clarifier certainly helps. My pre-election model was projecting the following:
- 11/01: 68K
- 11/02: 92K (160K total)
- 11/03: 92K (252K total)
- 11/04: 92K (344K total)
- 11/05: 75K (419K total)
- 11/06: 51K (470K total)
- 11/07: 92K (562K total)
- 11/08: 92K (654K total)
- 11/09: 85K (739K total)
I then went on to note that the actual tally for 11/09 specifically (the day after the election) turned out to be "over 100,000"...later clarified as 105,000 people, which is 24% higher than my own one-day projection.
My projections for the next few days were around 85,000 per day, for a cumulative total of 993,300 QHP selections via HealthCare.Gov as of November 12th.
Today CMS issued their first bi-weekly "snapshot" report. Lo and behold:
Biweekly Enrollment Snapshot • WEEKS 1 AND 2, NOV 1 - 12, 2016
In weeks one and two of Open Enrollment for the Health Insurance Martketplace for 2017, millions of people came to Healthcare.gov and shopped for quality, affordable plans. Over a million people selected plans using the Healthcare.gov platform since Open Enrollment began November 1, including about 250,000 new consumers and over 750,000 consumers renewing their coverage.
“We are all in for this Open Enrollment and excited that over 1 million people have already signed up for 2017 coverage through HealthCare.gov,” said Department of Health and Human Services Secretary Sylvia Burwell. “The American people are demonstrating how much they continue to want and need the coverage the Marketplace offers, and we are encouraging all Americans who need health insurance for 2017 to visit HealthCare.gov or their state Marketplace and check out their options. Most consumers can find a plan for $75 or less per month, and consumers should enroll by December 15th for coverage that starts January 1st.”
As in past years, enrollment weeks are measured Sunday through Saturday. Therefore, this year, week one was only five days long, from Tuesday to Saturday, and thus this biweekly snapshot covers the first twelve days. There were 53,000 more plan selections during the first 12 days of Open Enrollment this year than last year. Moreover, enrollment accelerated on November 9th, as CMS launched additional outreach. Over 300,000 people selected plans from November 9th through November 11th.
...Federal Marketplace Snapshot • Weeks 1 and 2 • Nov 1 – 12
- Plan Selections (net): 1,008,218
- New Consumers: 246,433
- Consumers Renewing Coverage: 761,785
- Consumers on Applications Submitted: 2,057,759
- Call Center Volume: 1,247,899
- Calls with Spanish Speaking Representative: 87,126
- HealthCare.gov Users: 4,528,675
- CuidadoDeSalud.gov Users: 133,081
- Window Shopping HealthCare.gov Users: 1,207,985
- Window Shopping CuidadoDeSalud.gov Users: 16,230
OK, so for the first 12 days I actually undershot slightly, by about 15,000 people or 1.5%. Not bad, especially considering the election results (which I worried would cause enrollments to plummet).
It's also worth noting that (net) qualifier. As noted in the glossary, like last year, HC.gov has gotten much better at purging the enrollment data of cancelled plans...that is, people who went through the entire process of enrolling, but then changed their mind a few days later and cancelled, or have already had their enrollments rejected by the insurance carrier for one reason or another. This means that the numbers being reported should be cleaner/more accurate than they were in 2014 and 2015 (they started this "pre-purging" last year as well but I didn't realize it until halfway through the enrollment period).
Also worth noting: 24% of all enrollments so far are new enrollees. This is an important number to keep an eye on, since my 13.5 - 14.0 million QHP projection assumes around 5.0 - 5.5 million enrollees who aren't currently enrolled via ACA exchange plans already (HHS assumes only around 4.6 million new additions, though their total projection is about the same as mine).
UPDATE: As Larwit notes in the comments, it's also useful to compare this year's "2 week" snapshot vs. last year's...taking into account the fact that there are 2 days missing this time around:
- OE3: 11/01 - 11/14 (14 days): 1,077,876 QHPs (77,000/day)
- OE4: 11/01 - 11/12 (12 days): 1,008,218 QHPs (84,000/day)
That's a 9% average increase over last year so far. If that pace keeps up, the final tally will be 13.84 million...just a hair ahead of HHS's projections.
However, due to the whole unknown active renewal/passive renewal/new enrollee situation prior to 12/15, it's also worth noting the new vs renewal numbers:
- OE3: 14 days: 711,400 renewals (50,800/day)
- OE4: 12 days: 761,784 renewals (63,500/day)
Current enrollees are actively renewing their policies 25% faster so far.
- OE3: 14 days: 366,476 new enrollees (26,176/day)
- OE4: 12 days: 246,433 new enrollees (20,536/day)
New enrollees are signing up at a rate 22% lower so far.
What does this mean? Impossible to tell, really. Perhaps nothing.
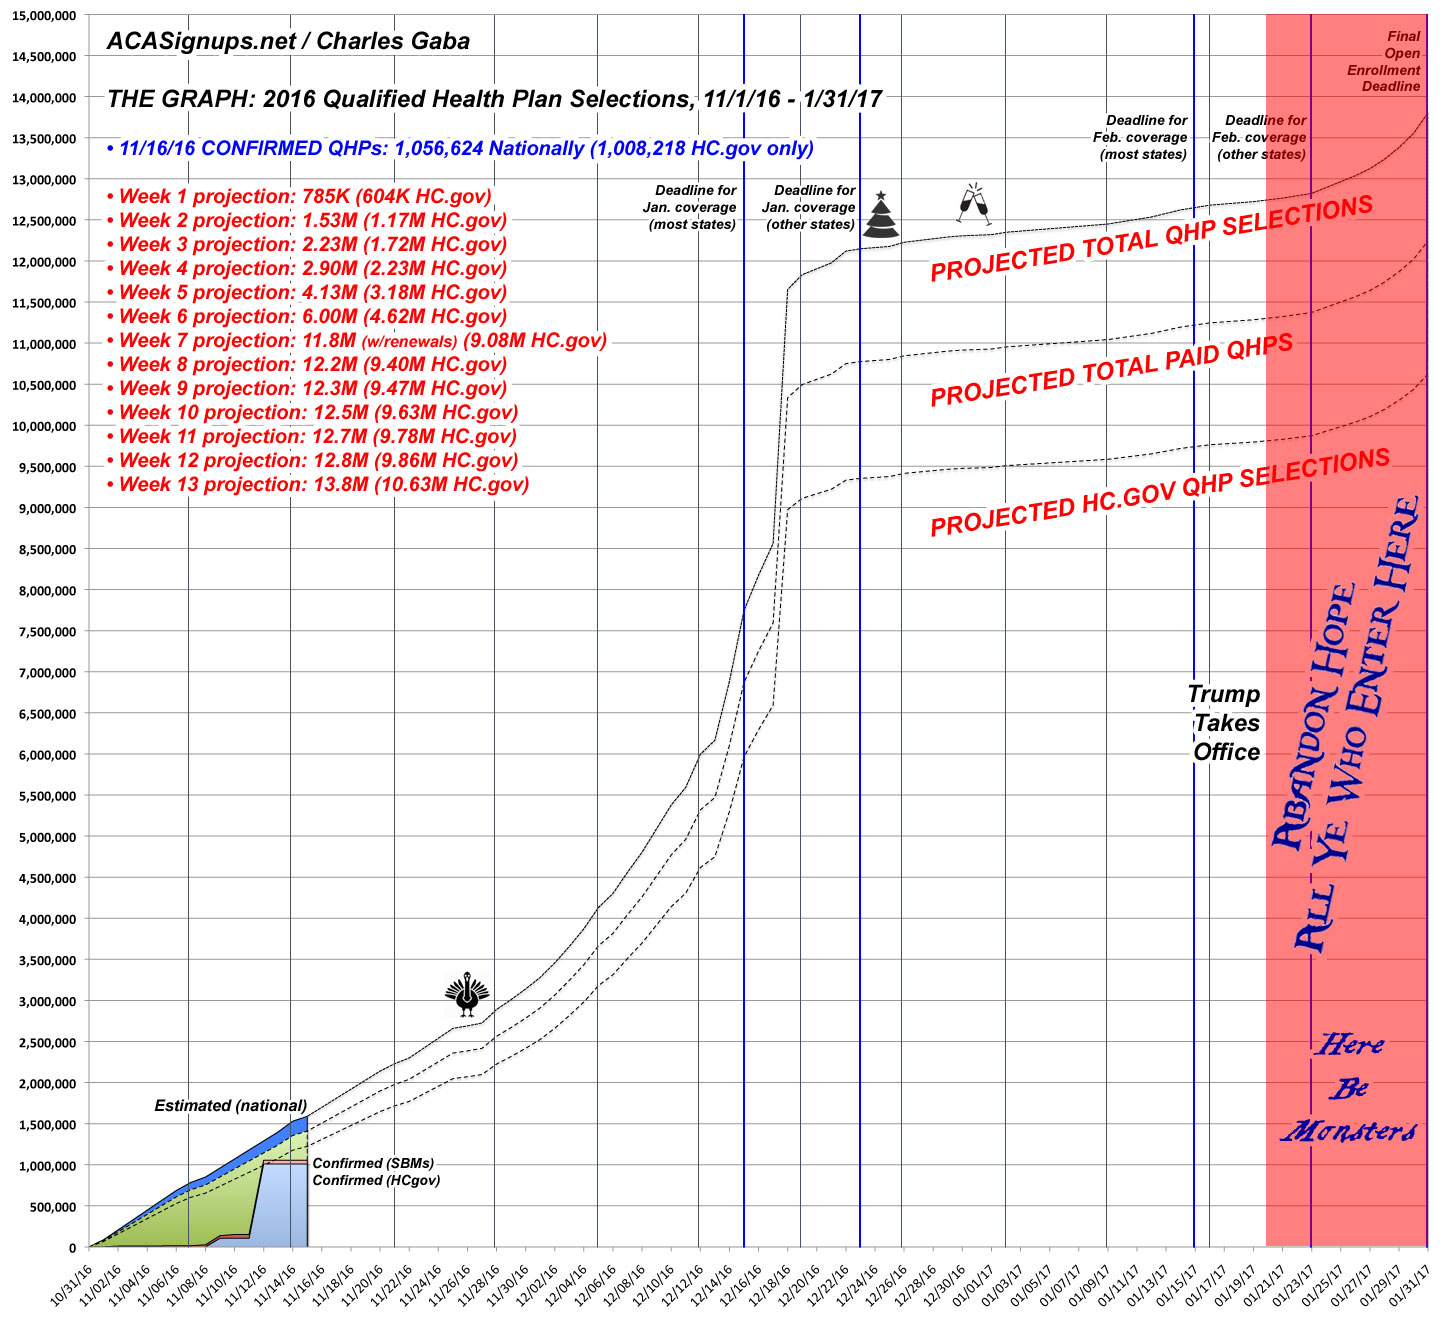
Unfortunately, they didn't provide a state-by-state breakout today, but plugging the HC.gov number into the spreadsheet makes The Graph look like so:
Advertisement
