Washington, DC –The DC Health Benefit Exchange Authority (DCHBX) Executive Board voted to adopt recommendations from its Social Justice and Health Disparities Working Group, in an effort to stop racism in health care. These recommendations are focused on three crucial areas in order to establish practices, structures, and policies that can be implemented by DCHBX and DC Health Link health plans to (1) expand access to providers and health systems for communities of color, (2) eliminate health outcome disparities for communities of color, and (3) ensure equitable treatment for patients of color in health care settings and in the delivery of health care services. There are 100,000 people and more than 5,200 employers with private health insurance coverage through DC Health Link. DCHBX is responsible for DC Health Link – the Affordable Care Act on-line health insurance marketplace in DC. The recommendations are for coverage through DC Health Link. However, several recommendations will also benefit residents not covered through DC Health Link.
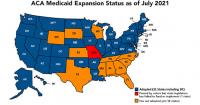
As I (and others) have written many times, closing the so-called "Medicaid Gap" is one of the trickiest challenges President Biden and Congressional Democrats face when it comes to strengthening and improving the Affordable Care Act.
Once again: Under the ACA, all Americans earning up to 138% of the Federal Poverty Level (FPL)... roughly $17,700/year for a single adult or around $36,500 for a family of four...were supposed to be eligible to join Medicaid regardless of their health status, whether they had kids and so forth.
This was supposed to be the case in all 50 states and the District of Columbia (I'm not sure about Puerto Rico or the other U.S. territories...many ACA provisions never applied to them in the first place).
Unfortunately, one of the major consequences of the NFIB vs. Sebelius Supreme Court Case in 2012 was that expansion of the Medicaid program has to be voluntary on the part of each state.
Tennessee fires top vaccine official as COVID-19 shows signs of new spread
The Tennessee state government on Monday fired its top vaccination official, becoming the latest of about two dozen states to lose years of institutional knowledge about vaccines in the midst of the coronavirus pandemic.
The termination comes as the virus shows new signs of spread in Tennessee, and the more-transmissible delta variant surfaces in greater numbers.
Dr. Michelle Fiscus, the medical director for vaccine-preventable diseases and immunization programs at the Tennessee Department of Health, said she was fired on Monday afternoon and provided a copy of her termination letter. It provides no explanation for her termination.
I didn't make any specific projection for the end of June as I've been swamped with my COVID vaccination tracking project, though I generally expected the enrollment pace to drop off significantly (anyone enrolling in June didn't have their policy kick in until July 1st, meaning their deductible & out-of-pocket cap would be the same even though they're only getting 6 months to use them up). Several hundred thousand more was a reasonable assumption, which would probably bring the national total up to somewhere in the 2 million range.
ST. PAUL, Minn.—Health insurance helps individuals and families prepare for life’s unexpected challenges. To enable more Minnesotans to gain the security of health insurance during the COVID-19 pandemic, MNsure has offered a five-month special enrollment period (SEP) that closes this Friday, July 16, 2021.
If you’re uninsured or are currently enrolled in a health plan outside of MNsure, the COVID-19 SEP is a unique opportunity for you to find affordable, comprehensive health care coverage for 2021 through MNsure. The next open enrollment window won’t be until November 2021, with coverage beginning in January 2022—so don’t wait!
For the updated graph below, I've made a few more tweaks to both my data sources and the graph itself, neither of which makes that much of a difference in terms of impact on the final results:
A few weeks ago, after the Centers for Medicare & Medicaid (CMS) confirmed over 80 million Americans were enrolled in Medicaid or the CHIP program as of January 2021, I posted an analysis which looked at state Medicaid enrollment data beyond January.
While the "thru dates" vary from as early as February to as recent as June, my overall conclusion was that actual total Medicaid/CHIP enrollment as of last month has continued to grow, and now likely stands at more like 88 million. It's even conceivable that it's broken the 90 million threshold as of July.
As I noted:
Since then, the combination of sudden, massive unemployment combined with the Families First & CARES COVID Relief acts (which boost federal funding of Medicaid programs while also prohibiting states from disenrolling current Medicaid enrollees during the public health crisis) have resulted in overall Medicaid enrollment rising dramatically over the past year and a half.
This morning, President Biden signed an executive order entitled "Promoting Competition in the American Economy" which hopes to promote competition across major sectors of the U.S. economy. There's 72 initiatives across a dozen agencies total impacting a wide range of industries; naturally this includes healthcare policy and the HHS Dept.
In the healthcare field, there are four areas addressed by Biden's XO: Prescription drugs, hearing aids, hospital consolidation and the ACA exchange marketplaces:
Prescription Drugs: Americans pay more than 2.5 times as much for the same prescription drugs as peer countries, and sometimes much more. Price increases continue to far surpass inflation. As a result, nearly one in four Americans report difficulties paying for medication, and nearly one in three Americans report not taking their medications as prescribed.
Colorado's Health Insurance Marketplace Maintains Enrollment Momentum
There's still time to enroll
DENVER – As of Wednesday, July 7, 205,813 Coloradans have signed up for a plan that provides coverage this year through Connect for Health Colorado. That’s an additional 5,000 enrollments since last month when Connect for Health Colorado announced its Marketplace had reached a historic enrollment milestone for the 2021 plan year.
That's actually 5,694 more enrollees since June 7th, although they may be knocking it down a bit to account for attrition/etc. That amounts to 190 additional enrollees per day, which is actually up from the ~167/day which Colorado had been averaging from May through June. Huh.
For nearly a year, I posted a weekly analysis of the 100 U.S. counties (out of over 3,100 total) which had the highest cumulative rates of COVID-19 cases and deaths per capita. In addition, I also included a running graph which compared the ratio of COVID cases & deaths per capita between blue and red counties to track how this changed over time.
The results were extremely telling: In the early days of the pandemic back in March/April 2020, the blue counties were devastated for a variety of reasons, including heavy population density, the fact they were mostly located along the coasts (usually in cities with major international ports/airport hubs), and so forth. Democrats tend to live in heavily-populated urban areas, while Republicans are prone to live in more sparsely-populated rural areas, so this made sense.
For the first few months, both case and death rates were running as much as 4-5x higher in counties which voted solidly for Hillary Clinton in 2016/Joe Biden in 2020 than in those which voted for Trump in either 2016 or 2020.