

Updated: Massachusetts: #COVID19 vaccination rates by county & partisan lean
Sun, 05/30/2021 - 1:23pm
Now that I've developed a standardized format/layout & methodology for tracking both state- and county-level COVID vaccination levels by partisan lean (which can also be easily applied to other variables like education level, median income, population density, ethnicity, etc), I've started moving beyond my home state of Michigan.
Here's Massachusetts:
- 2020 Presidential Election results via MA Secretary of State's office (thru Wikipedia)
- Vaccination data via Centers for Disease Control database
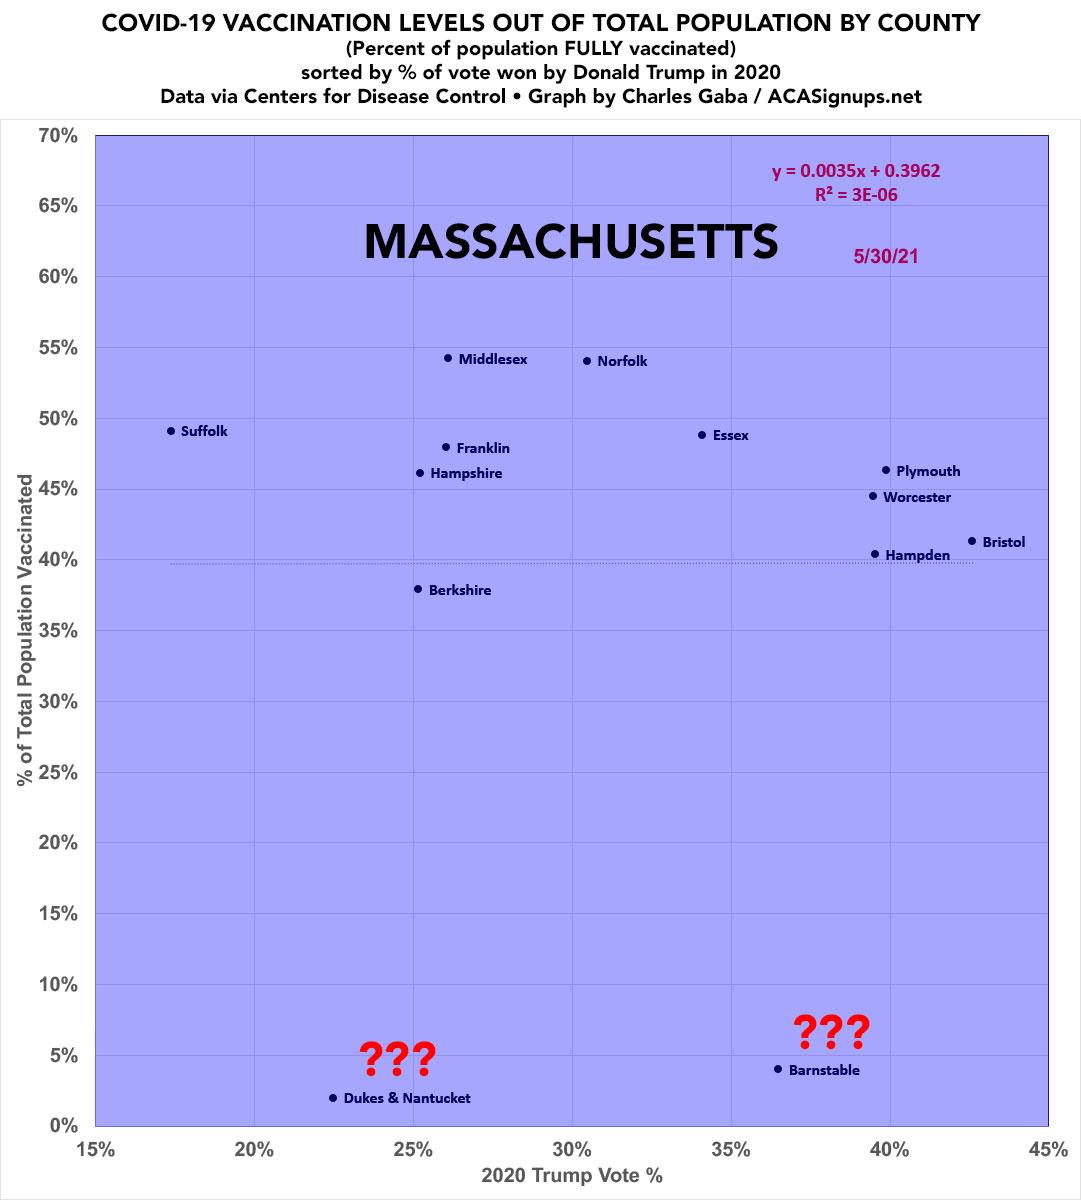
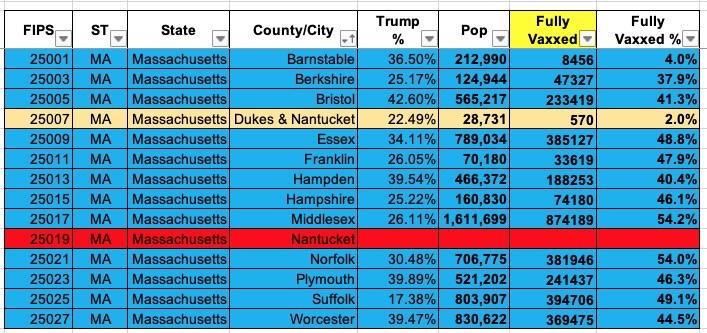
Note: The CDC lists ~413,000 Massachusetts residents (12.3% of the total fully vaccinated) whose county of residence is unknown.
For Massachusetts, it's important to note several things: First, every county in the state voted for Joe Biden by a wide margin (Bristol is the closest thing the state has to a "swing district").
Second, there's very little variance in vaccination rates between them as of today...with two weird exceptions: Barnstable and Dukes/Nantucket...in which, according to the CDC, only 4% and 2% of residents have been vaccinated to date, which makes zero sense whatsoever.
I know that Dukes & Nantucket are often merged for purposes of county-level data, and have a far lower combined population than the rest of the state, so I assume there's some unusual "county classification" going on there, or that the residents are reported as residing elsewhere or something. I don't know what the deal is with Barnstable, however.
Combine this with the unusually high "unknown" vaccination rate (no other state I've seen so far has had more than half as many in that category) and I'm not sure what to make of Massachusetts.
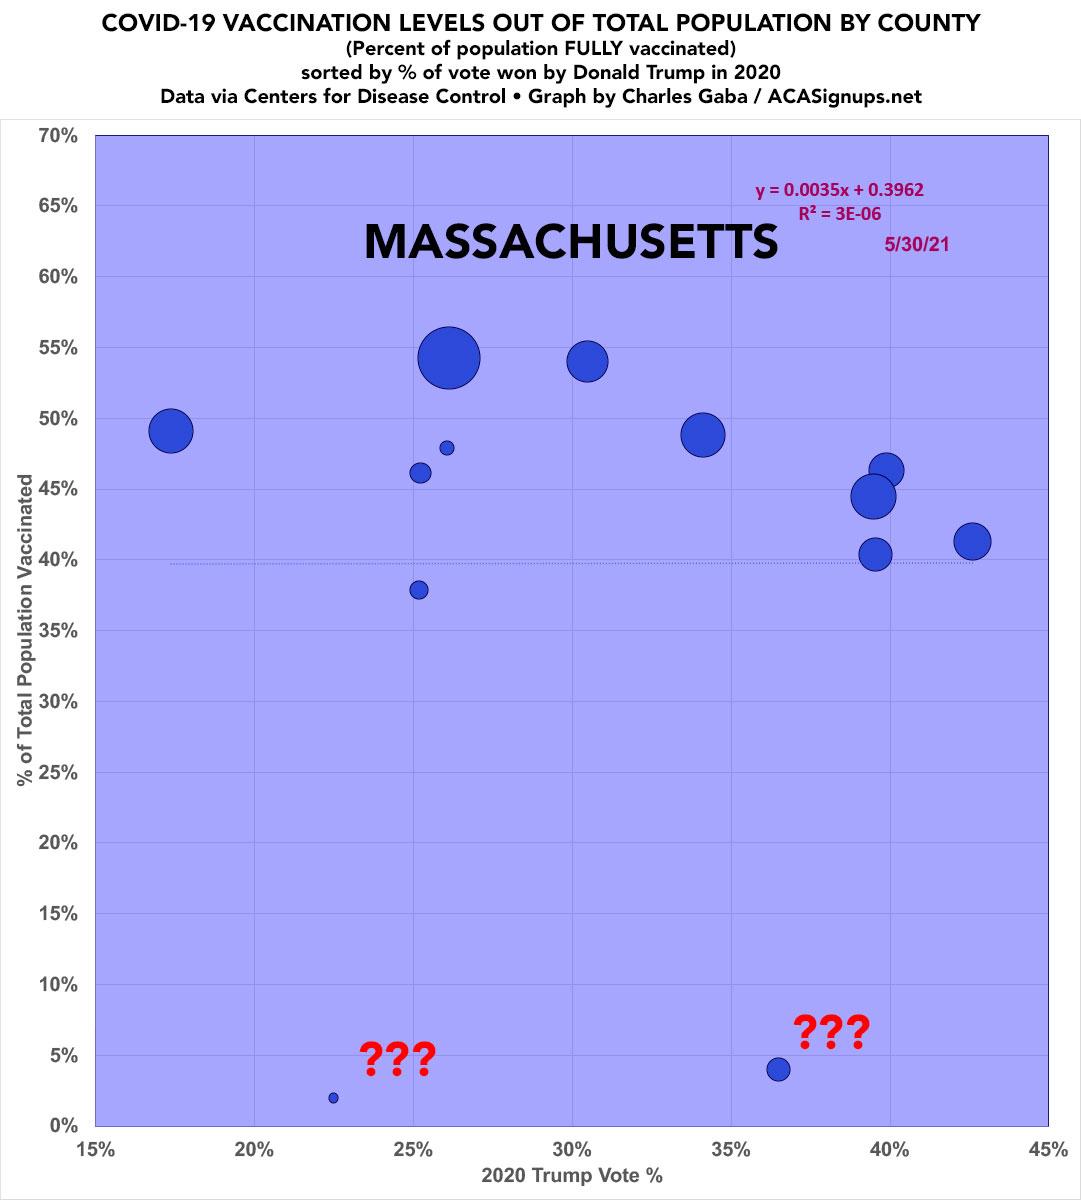
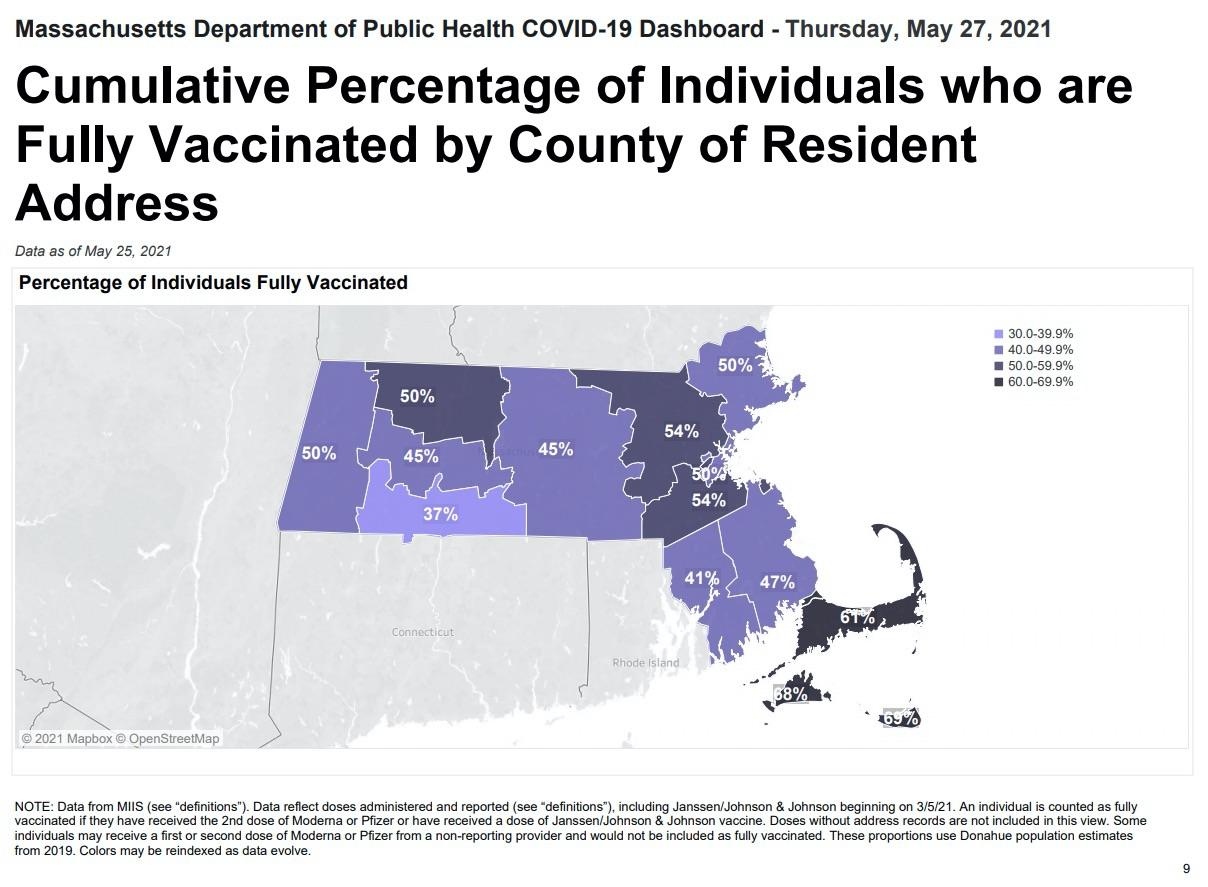
UPDATE: There's definitely something weird going on with Dukes/Nantucket and Barnstable. Here's a map directly from the Massachusetts Health Dept. clearly showing Barnstable at 61% fully vaxxed and Dukes/Nantucket at 68/69%. Weird.
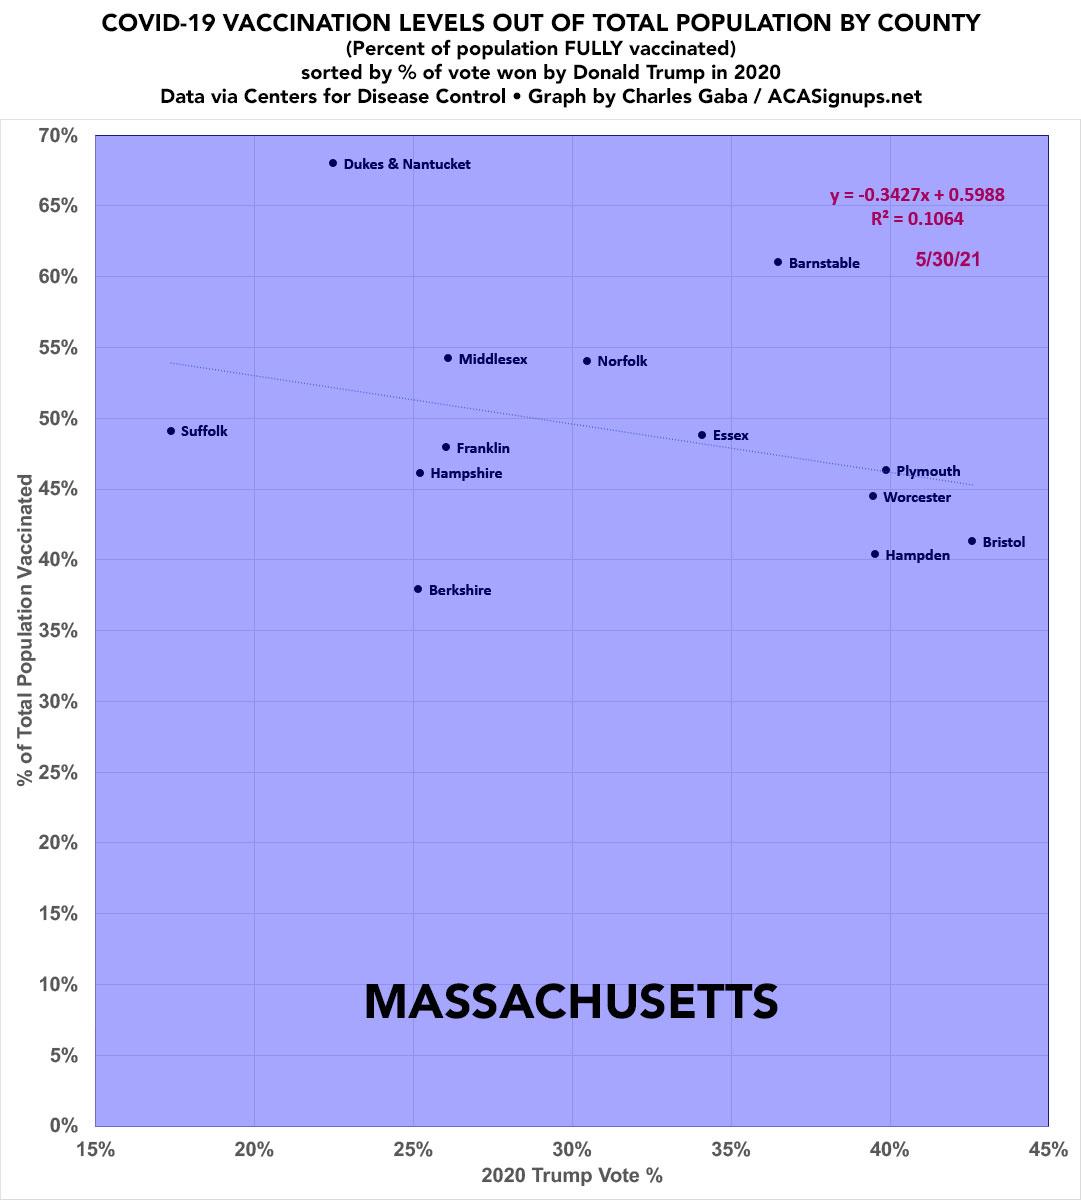
I'll post any further updates as they develop, but in the meantime here's what I'm pretty sure the scatter plot graphs should look like:
Advertisement
