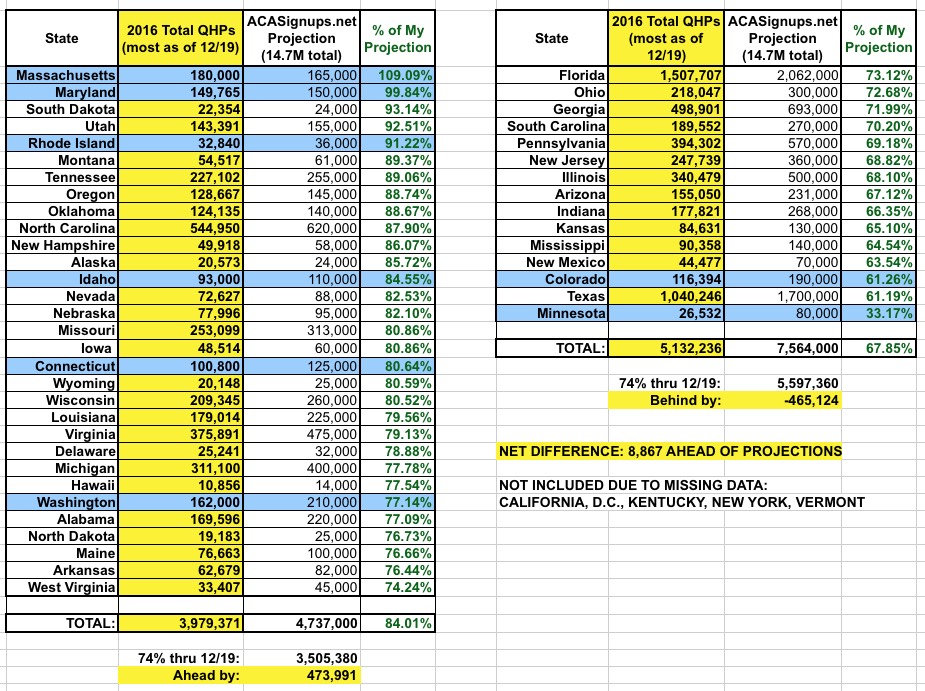
On the one hand, the total numbers to date sound pretty impressive, and over 20 states are running well ahead of my projections so far (Massachusetts & Maryland have already hit my targets; SD, UT, RI, MT & TN are close behind). On the other hand, I'm also starting to see some worrying signs in a few large states, particularly Texas, Illinois, New Jersey and Pennsylvania.
Here's an irony for you: Take a look at what the state-by-state chart looks like when you divide it into the states which are currently above where I expected them to be right now and those which are behind (remember, 5 states aren't listed at all, since they haven't provided any data at all or only very limited in the case of California):
Open Enrollment Trends: Selected HealthCare.gov Statistics prior to the January 1, 2016 Coverage Deadline
Since Open Enrollment began on November 1, millions of Americans have learned about the financial help available and selected quality plans through the Marketplace for 2016. While six weeks remain before the final deadline, early consumer behavior and enrollment trends are beginning to surface. The following charts provide a preliminary analysis of plan selections ahead of the deadline for January 1 coverage through the HealthCare.gov platform.
I launched the "State by State" chart feature towards the end of the 2015 Open Enrollment period last time around, and it proved to be pretty popular, so I've brought it back this year.
It's important to note that I'm still missing data from some state exchanges; I have bupkis from DC, Idaho, Kentucky, New York and Vermont. I also only have partial data from others (California includes new enrollees only, while several other states only have data for the first couple of weeks).
With all those caveats out of the way, here's where things stand. Just like last year:
As I expected, the Week Seven numbers were a bit confusing due to a) the deadline surge; b) the 2-day extension of the deadline and especially c) the auto-renewal factor. While "the vast majority" of auto-renewals (2.28 million of them) were already added to the Week Seven total, CMS says that there are still "some" auto-renewals yet to be added. I wasn't expecting them to spill auto-renewals over into the following week, so things are kind of messy this week.
In addition, while these won't impact the federal exchange numbers, several state-based exchanges (Maryland, Massachusetts, Minnesota, New York, Rhode Island and Washington State) have/had January deadlines later than the 12/17 one on the federal exchange and some other states, so there's a lot of bumpy numbers going into Week Eight.
Update 12/18/15: Not really an update so much as a clarification: I'm guessing active QHP selections for this week via HC.gov could run anywhere between 1.0 - 2.0 million, plus another 2.5 - 3.5 million automatic renewals, for a weekly total of between 3.5 - 5.5 million.
Remember that HC.gov generally represents about 3/4 of national enrollments, so for Wednesday and Thursday, I assumed around 300K active selections per day for the federal exchange.
The Affordable Care Act’s third open enrollment period will end on Jan. 31, but the latest Kaiser Health Tracking Poll finds that only a small share of people without health insurance realize it.
Just 7 percent of the uninsured correctly identify January as the deadline to enroll; another 20 percent say the deadline is at the end of 2015, while everyone else either says they don’t know, gives another date or says the deadline has already passed.
Week 6 Projection: 1.50 Million / Actual: 1.33 Million (over by 13%)
Cumulative Projection: 4.34 Million / Actual: 4.17 Million (over by 4%)
Given the crazy developments of the past day or so, combined with the auto-renewal factor, things are kind of fuzzy this week. I'm gonna hold tight and assume roughly 4.3 million QHPsincluding auto-renewals will be added to the mix by Saturday, bringing HC.gov up to a total of 8.5 million by Saturday, December 19th.
However, there's a major caveat here: I have no idea how many auto-renewals will be added, so I could easily be off by as much as a half a million or so this week.
Update 12/18/15: Not really an update so much as a clarification: I'm guessing active QHP selections for this week via HC.gov could run anywhere between 1.0 - 2.0 million, plus another 2.5 - 3.5 million automatic renewals, for a weekly total of between 3.5 - 5.5 million.
REMEMBER, as always, that this only includes the 38 states included on the federal exchange; when you throw in the other 13 running their own exchanges, the grand total (assuming I'm in the ballpark) should be roughly 11.3 million QHPs nationally by the end of the week.
I launched the "State by State" chart feature towards the end of the 2015 Open Enrollment period last time around, and it proved to be pretty popular, so I've brought it back this year.
It's important to note that I'm still missing data from some state exchanges; I have bupkis from DC, Idaho, Kentucky, New York and Vermont. I also only have partial data from others (California includes new enrollees only, while several other states only have data for the first couple of weeks).
In addition, there are three states (Connecticut, Rhode Island and Washington State) where I have the opposite situation--they've front-loaded their autorenewals of current enrollees, with the understanding that those folks can still drop their coverage or switch to a different policy between now and December 15th (CT) or December 23rd (RI & WA).
With all those caveats out of the way, here's where things stand. Just like last year:
I'm sticking to my guns for Week 6, projecting an even 1.5 million QHP selections via HealthCare.Gov, bringing the grand total to 4.34 million as of 12/12.
REMEMBER, as always, that this only includes the 38 states included on the federal exchange; when you throw in the other 13 running their own exchanges, the grand total by the 12th should be roughly 5.76 million QHPs nationally.
More than 1.3 million consumers signed-up for health coverage through the HealthCare.gov platform between December 6 and December 12, the last full week before the deadline for January 1 coverage, bringing the total number of plan selections made since Open Enrollment began on November 1 to 4.17 million consumers. Approximately 500,000 were new consumers, for a cumulative total of about 1.5 million new consumers since the beginning of Open Enrollment.