

Pennsylvania: Effectuated enrollment drop not as bad as Pennie suggests but the trend line isn't pretty...
At leasts 600,000 Americans have lost ACA coverage across 11 states so far

Via Pennie, Pennsylvania's state-based ACA exchange:
Federal Premium Tax Credits have been an important aspect of affordability for marketplace enrollees since the adoption of the Affordable Care Act. Premium tax credits lower the cost of private health plans available through the marketplace and are based on income and household size.
Since 2021, Enhanced Premium Tax Credits (EPTC) totaling $600 million annually in Pennsylvania alone made coverage more affordable than ever for enrollees. As a result, Pennie saw enrollment increase by 50% from 2021 to 2025. Pennie enrollment reached its highest point at half a million total enrollees in 2025. The enhanced tax credits expired at the end of 2025, and Pennie enrollees saw costs double on average to keep their plan in 2026.
Open enrollment 2026 ended on January 31, 2026, and an unprecedented 85,000 Pennie enrollees made the choice to leave coverage offered through Pennie. Many of these individuals are now uninsured. The terminated population cited the loss of the enhanced tax credits and increased premiums as the primary reason for leaving, and the number leaving continues to grow.
Affordable and accessible health insurance for all eligible Pennsylvanians remains a top priority for Pennie.
...As of May 1, 2026, total Pennie enrollment was 452,525.
Since the close of OE 2026, January 31, 2026, an additional 60,000 consumers have dropped coverage through Pennie.
In total, including Open Enrollment 2026, Pennie has seen over 145,000 individuals cancel coverage.
As ugly as this figure is, I have to admit that it's a little bit misleading, in that it includes those who terminated coverage but not those who newly enrolled in coverage. While the terminations are important as well, my standard measurement is the total number of effectuated enrollees each month (which includes both additions and subtractions).
On that front, the situation isn't nearly as dire...but it's still not looking good.
Official plan selections during the 2026 Open Enrollment Period (OEP) were actually slightly higher than they were during 2025 OEP, up 1% or roughly 4,800 more...and when comparing against the official 2025 Public Use File, effectuated enrollment in January was actually over 7% higher than it was in January 2025.
Since then, however, effectuated enrollment in Pennsylvania has indeed dropped off steadily...it was 1.2% lower in March, 3% lower in April and is 5.2% lower as of May than it was during the same months a year ago:
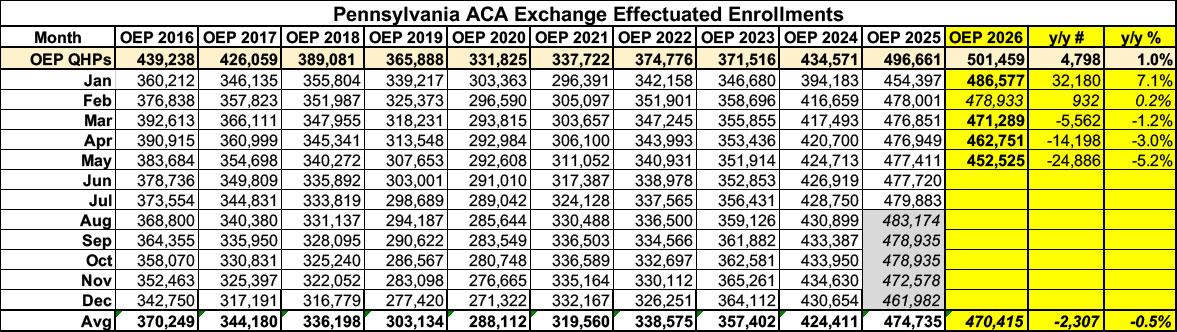
This translates into a net enrollment drop of nearly 25,000 people in May and an average monthly drop of about half a percent, or 2,300 people so far this year.
Here's what that looks like visually, with projections for the balance of the year assuming the trend line follows either the 2025 or 2019 models:
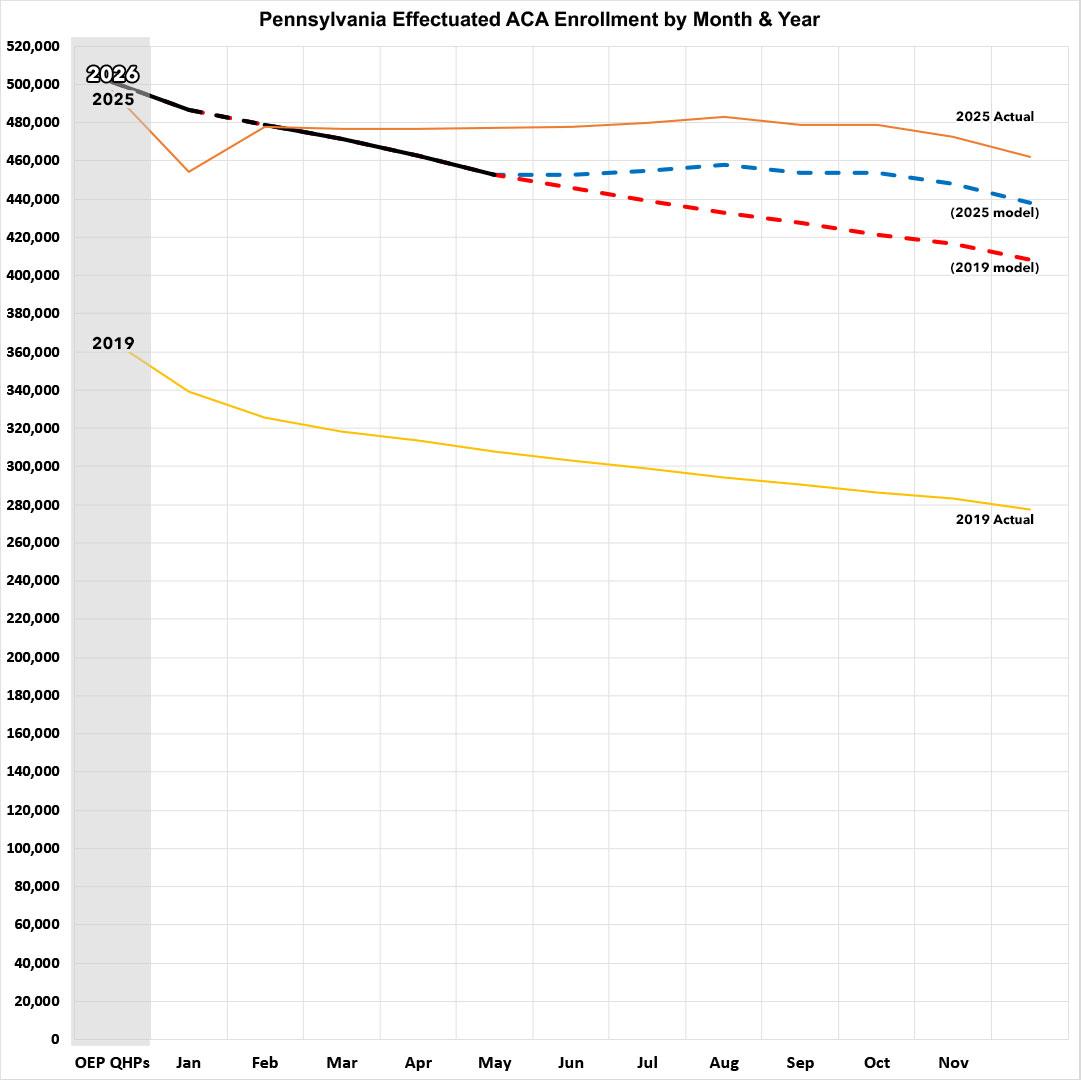
- If the rest of the year follows the 2025 pattern, effectuations will end December at around 437,000 and will average around 459,000 for the year...down 3.3% compared to 2025.
- If the rest of the year follows the 2019 pattern, effectuations will be at around 408,000 by December, and the average for the year will be around 445,000...down 6.2% y/y.
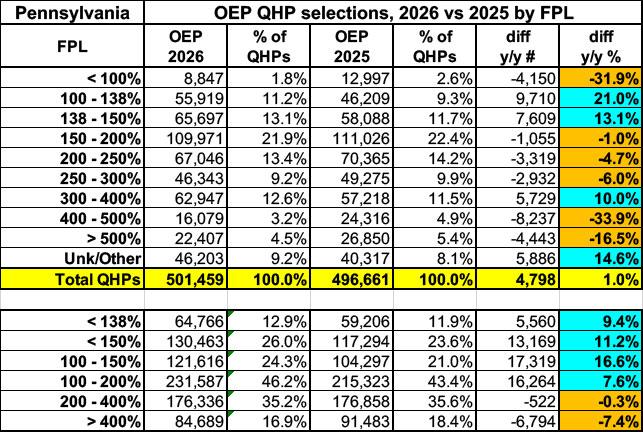
The breakout by income bracket is pretty much what I'd expect for most states which don't have any sort of supplemental state-based subsidies for lower income enrollees: Enrollment below 100% FPL and just over 400% FPL have both dropped by around a third while enrollment just over 100% & just under 400% FPL have increased, presumably due to those just below/above those thresholds projecting 2026 income within the 100 - 400% FPL subsidy eligible range (and now praying they're able to actually pull that off for real):
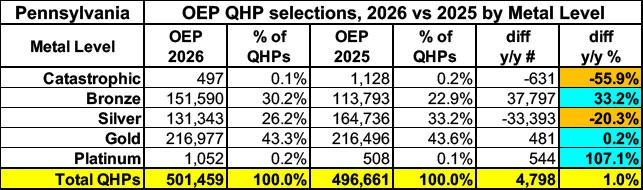
Metal level enrollment shifts are also mostly what I'd expect, with a lot of people downgrading from Silver to Bronze to avoid/mitigate the premium hikes. The only real surprises are that Catastrophic enrollment actually dropped by more than half while Platinum enrollment more than doubled...except both of those categories max out at around 1,000 people anyway, mostly rounding errors.
Here's where things stand so far...
- California: OEP down 2.6%; February effectuations down 8.5%
- Colorado: OEP down 1.9%; March effectuations down 6.1%
- Georgia: OEP down 12.3%; April effectuations down 28.1%
- Maryland: OEP up 3.4%; April effectuations down 6.3%
- Massachusetts: OEP up 3.7%; April effectuations down 4.3%
- Minnesota: OEP down 8.1%; February effectuations down 8.6%
- New Jersey: OEP down 0.8%; April effectuations down 11.6%
- New Mexico: OEP up 18.1%; May effectuations up 5.6%
- New York: OEP down 4.9%; May effectuations down 8.7%
- Pennsylvania: OEP up 1%; May effectuations down 5.2%
- Washington: OEP down 5.9%; February effectuations down 15.7%
In terms of year over year average monthly effectuated enrollment as of the months of the latest data:
- California: Down ~110,000
- Colorado: Down ~13,400
- Georgia: Down ~370,000
- Maryland: Up ~7,000
- Massachusetts: Up ~1,600
- Minnesota: Down ~10,000
- New Jersey: Down ~57,000
- New York: Down ~14,500
- New Mexico: Up ~7,200
- Pennsylvania: Down ~2,300
- Washington: Down ~33,000
- Total across 11 states: Down at least ~600,000
I'm still working on effectuated data for the remaining states which operate their own ACA exchanges: Connecticut, DC, Idaho, Illinois, Kentucky, Maine, Nevada, Rhode Island, Vermont & Virginia...and again, the official effectuated data for every state for the first part of the year likely won't be released by CMS until sometime in July.
Stay tuned...
Advertisement
