

The Graph Returns...sort of.
Wed, 12/03/2025 - 1:54pm
For 12 years now, one of the traditions of ACA Signups has been The Graph: A line graph tracking enrollment in ACA policies over the course of each Open Enrollment Period.
The original Graph from 2013-2014 looked quite different from more recent years, partly because I was attempting to track Medicaid/CHIP enrollment and other coverage categories at the same time, and partly because, frankly, I didn't really know what I was doing at the time.
Over the next few years I modified & improved both my methodology as well as the format, culminating in last year's 2025 Open Enrollment Period Graph, which featured the highest enrollment figures in the ACA's history: ~24.3 million Qualified Health Plan (QHP) enrollees, plus another ~1.8 million Basic Health Plan (BHP) enrollees in Minnesota, New York & Oregon specifically, for a grand total of just a hair over 26 million people.
For the 2026 Open Enrollment Period, however, actual hard enrollment data has been, shall we say, difficult to come by so far.
Historically, the Centers for Medicare & Medicaid Services (CMS) publishes occasional ACA Open Enrollment "Snapshot Reports" which provide above-the-fold data on how many Americans have enrolled in ACA exchange plans in every state. In recent years these reports have been released every two weeks or so.
Last year, the first official CMS snapshot report was released on Nov. 22nd. covering enrollment data through Nov. 9th in states operating their own exchanges & Nov. 16th in states hosted on the federal exchange.
The second snapshot report was published on Dec. 4th, covering data through either Nov. 23rd or Nov. 30th depending on the state.
This year? Well, it's December 3rd, and so far CMS has remained radio silent. It's certainly possible that they'll publish an enrollment snapshot report at any time, but as of this writing, they haven't.
The good news is that there's now 21 states operating their own ACA exchanges, many of which have historically published their own enrollment reports throughout the OEP.
The bad news is that so far only three of them have actually done so for the 2026 OEP: Maine (which also provides updates every 2 weeks); New Mexico (which has an enrollment dashboard which is updated daily); and California, which also has their own updated-daily dashboard.
I haven't bothered actually generating a 2026 Graph until now because I had so little data to work with: Maine & New Mexico are both low-population states with correspondingly tiny ACA enrollment numbers.
With the addition of California, however (the largest state as well as the largest state-run ACA exchange), I finally have enough data to make it worth doing so...although just barely so.
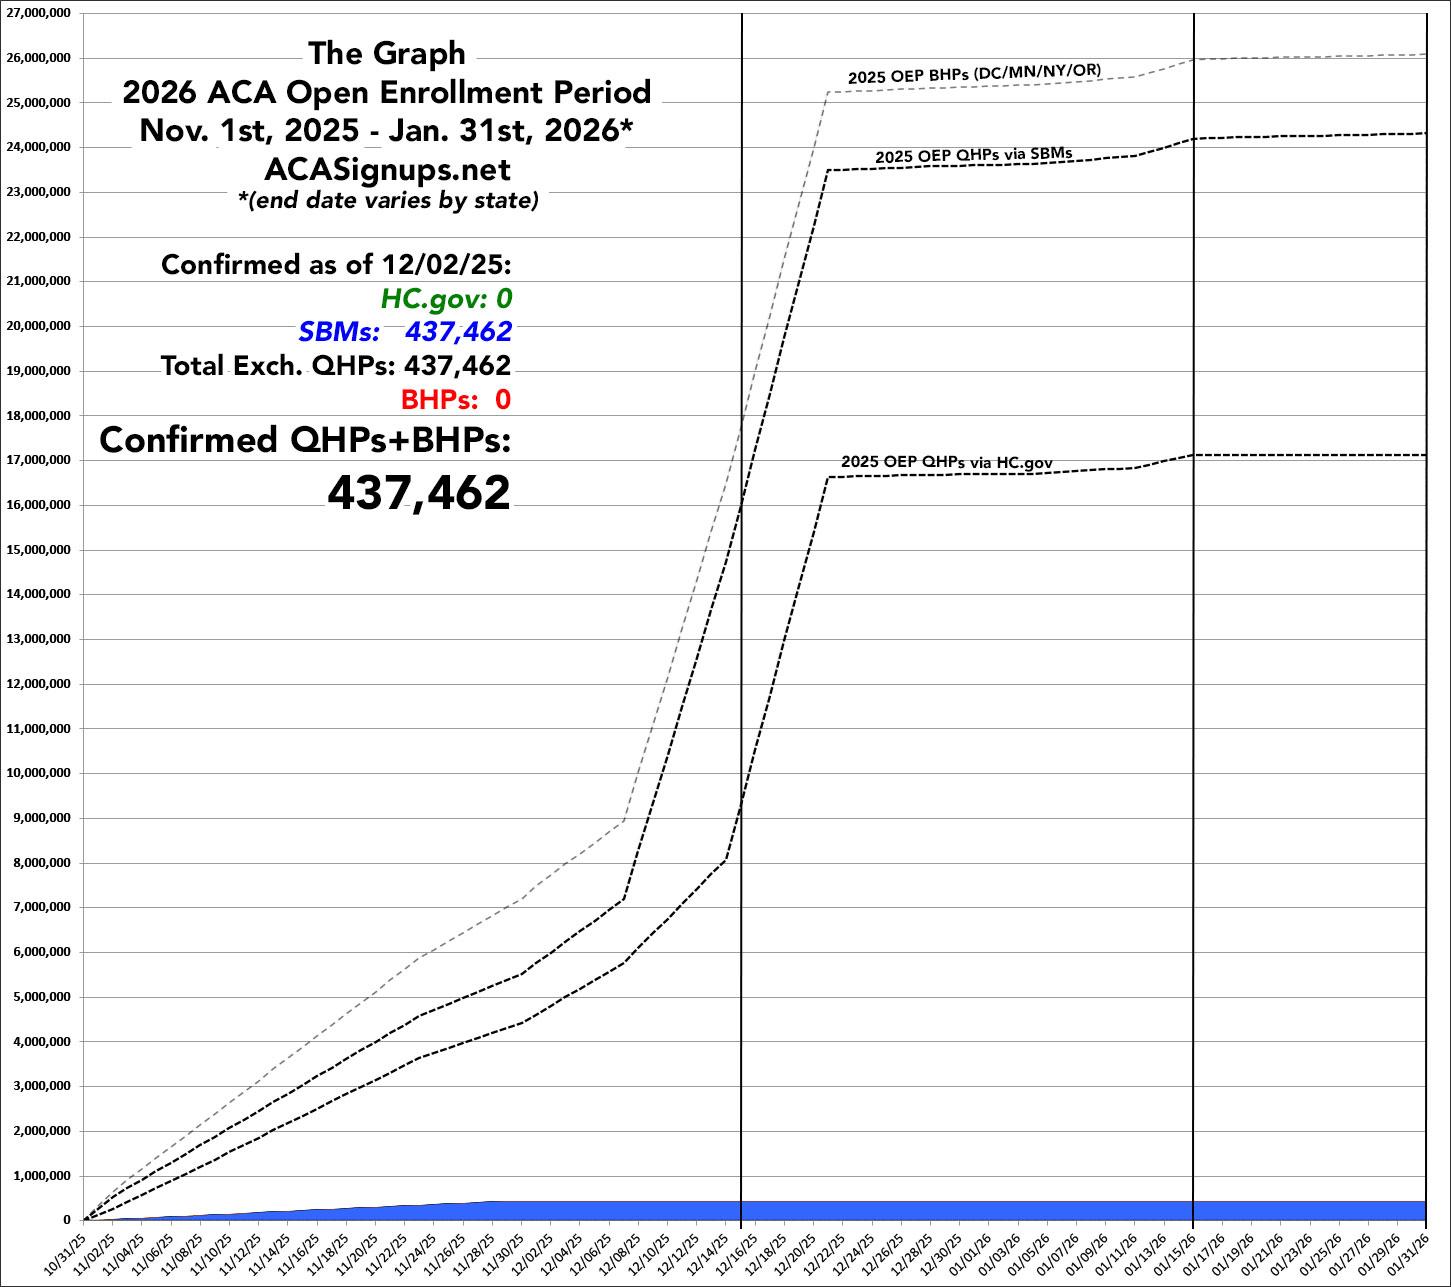
The data for all three states is updated as of either Nov. 29th or 30th; combined, they have 437,462 active enrollments (this includes both new enrollees as well as current enrollees who have actively selected a plan for 2026). By comparison, CA/ME/NM had 411,959 active enrollments as of 11/30 last year, so for these 3 states at least, the 2026 OEP is actually running 6.2% ahead of where it was a year earlier.
If I were to run a crude extrapolation nationally, this would amount to around 5.86 million QHP selections as of the end of November vs. 5.52 million a year earlier. I wouldn't go running around claiming that this is the true state of affairs, however, as it's sheer speculation.
With all of this in mind, here's the first iteration of the 2026 ACA Open Enrollment Graph (the dotted lines represent how many enrollees signed up in each category over time last year).
Advertisement
