

A simple actuarial analysis.
Wed, 09/08/2021 - 12:48pm
As I've been arguing for well over a year now, the COVID-19 pandemic was utterly politicized by the Trump Administration right from the start...and the vaccination effort has similarly been completely politicized by the Republican Party since the moment President Biden took office as well.
Aside from the massive public health fallout, this fact has all sorts of poltiical implications as well, of course. Most of those involve pundits speculating about "the blame game" and so on; will voters in states like Florida and Texas blame their governors for doing everything possible to stymie reasonable pandemic safety measures such as mask mandates, or will they blame the Biden Administration for...I don't know, not tying people to a chair and manually forcing the COVID vaccine into their arms?
For weeks now, however, people have been asking me an even more basic, crass question about the impact of political tribalism on the 2022 midterm election:
What I really want to know is when the number of deaths in the Trump counties reach a point where they could turn the county blue through sheer attrition.
— (@HKursed) September 3, 2021
My suspicion is that quite a number of Republican strategists are realizing this danger, and this is why in recent weeks Republicans have been a little bit more forthcoming on the vaccine.
— (@MarkusDeserno) September 3, 2021
I wondered that for the middle 2 bars - would death rates secure future Dem wins in 40-50% counties & give Dems a greater chance in the 50-60% ones. It’s a grotesque situation in every way.
— (@zvakanaka_) September 3, 2021
You get the idea. A bunch of people have asked me this, sometimes in a roundabout way; other times directly, like the first tweet above.
So...fine. Let's set our moral compass aside for a moment and look at this from an sheer "actuarial analysis" perspective.
First, let's look at the national COVID-19 death rates, broken out by 2020 Presidential election results, from the beginning of the pandemic in January 2020 right up through Election Day last year (November 3rd, 2020):
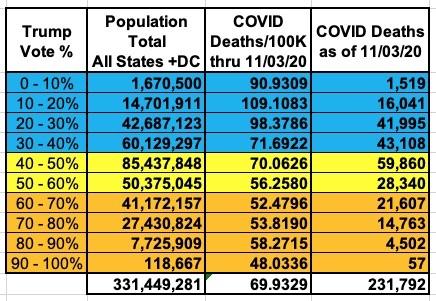
It's important to note that the data here includes all 50 states + DC, but does not include several thousand COVID deaths in which the county of residence was unknown. I should also note that the population data (and therefore per capita data) is based on the official 2020 Census numbers for each county.
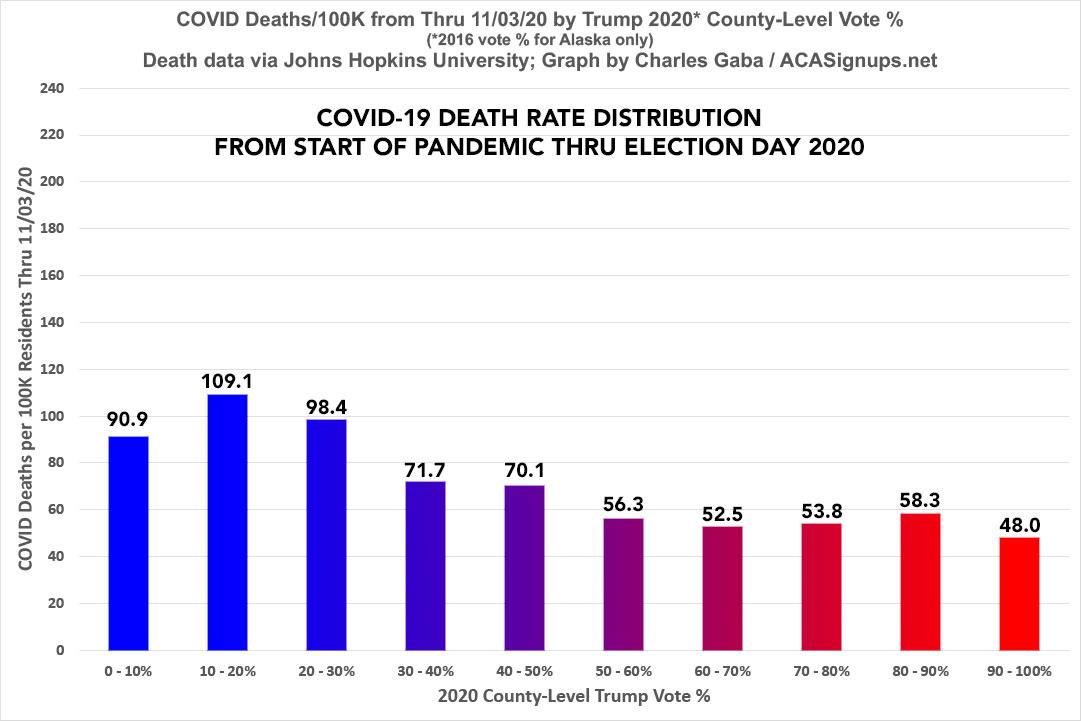
Here's what it looks like visually. As you can see, the death rate in the bluest areas of the country was as much as 2.3x higher than in the redder counties nationally. Most of this is due to the massive, ugly first wave in New York, New Jersey and other Democratic-leaning states back in March/April 2020:
OK, but what about after Election Day 2020?
For that, I've had to break it into two time periods: 11/04/20 - 6/30/21, and 7/01/21 until today. I had to do this for two reasons: First, because the beginning of July is right around the point that the far more contagious Delta variant started to pop up in the United States...but mostly because both Nebraska and Florida both decided to stop reporting COVID deaths at the county level in June.
Nebraska actually stopped publiching any county-level data on June 30th (including cases, etc.), but at least they publicly announced it ahead of time.
Florida, on the other hand, never really announced their decision to discontinue publishing county-level COVID death data, which they seem to have done starting on June 4th, 2021. They just...stopped. Florida's daily statewide COVID deaths stayed pretty steady throughout the rest of June, so I've been able to roughly extrapolate it for 6/04/21 - 6/30/21, but I don't feel comfortable trying to do that beyond June 30th, since again, that's when Delta started to run rampant across the state and the rest of the country.
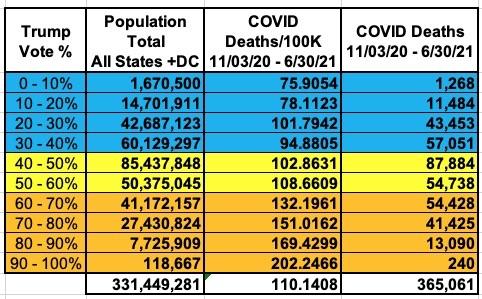
If you're surprised that there were more than 50% more Americans who died from COVID during the 8 months from the election through the end of June than there were in the 10 months from January - October 2020, you shouldn't be; remember, the daily death toll actually peaked in mid-January of this year, just before President Biden took office.
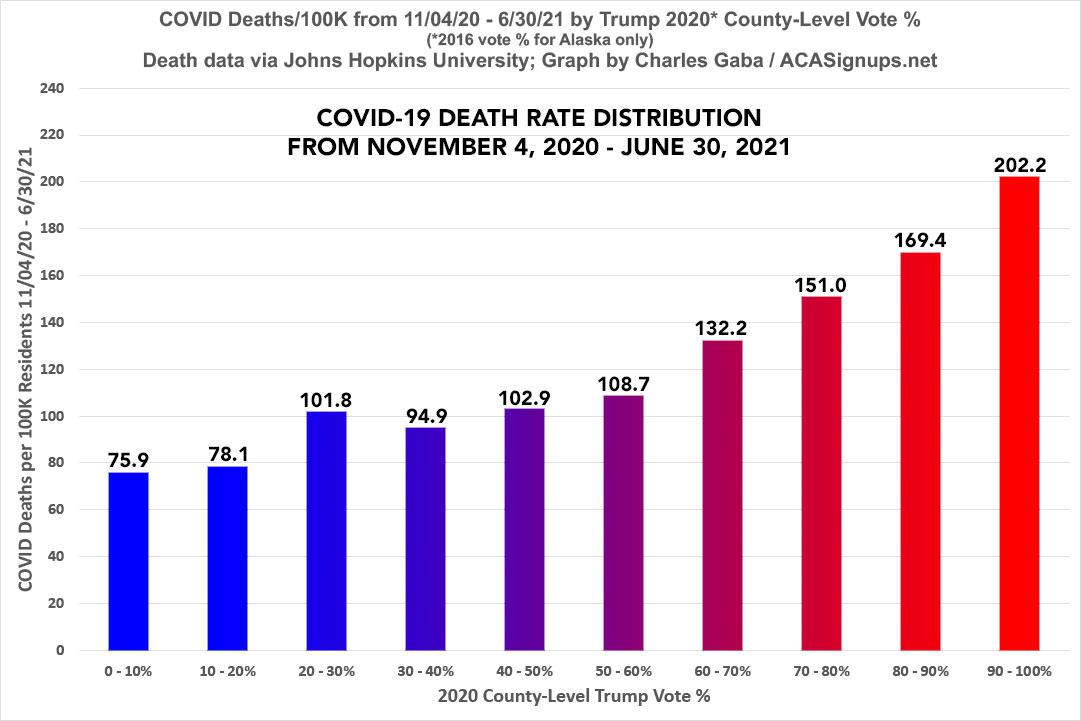
As you can see, from Election Day through the end of June, the situation completely reversed itself: The COVID-19 death rates in the reddest counties began to run higher than in the bluest counties...as much as 2.66x as high, in fact.
So, how does this play out in terms of Red/Blue "sheer attrition"?
First, you have to remember that not every American who has died of COVID since last November is a voter. A small percentage are either under 18 or aren't U.S. citizens. Even among those who are, total voter turnout among eligible voters last November was only around 66%...historically high, but that still removes a good 1/3 from the equation right off the bat.
That leaves perhaps 229,000 potential U.S. voters who died between 11/04/20 - 6/30/21.
The biggest unknown by far is what proportion of them were likely to vote Democratic or Republican in 2022. In the table below, I've made a spitball guesstimate about the proportions within each bracket:
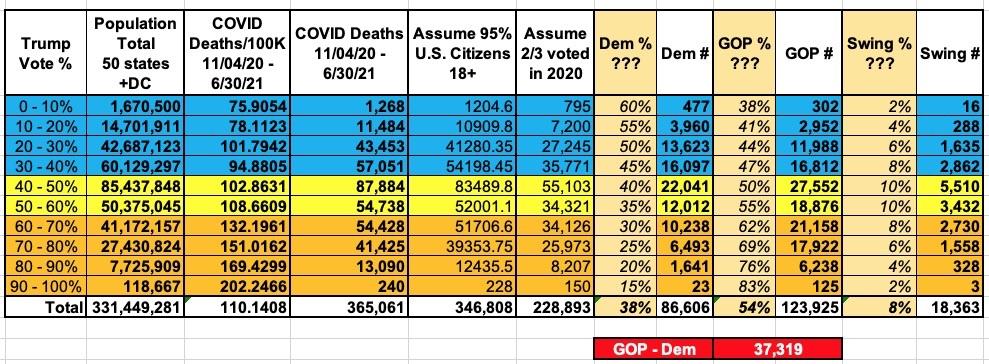
If my assumptions above are close to accurate (which is admittedly a big "if"), it would mean something like 87,000 Democratic voters and 124,000 Republican voters died during that time period, plus another 18,000 or so independents or swing voters, for a net loss of ~37,000 more Republican voters than Democratic nationally.
What about since the end of June?
For that, I unfortunately have to remove both Nebraska and Florida from the equation since I don't have county-level COVID death data for either state. Even so, as I've noted before, the results are pretty jaw-dropping:
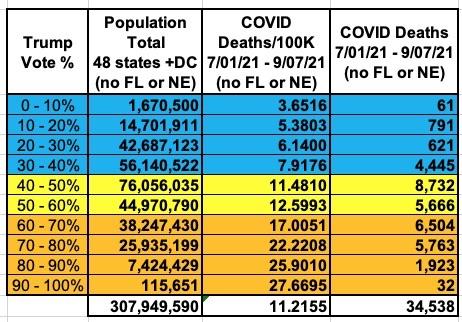
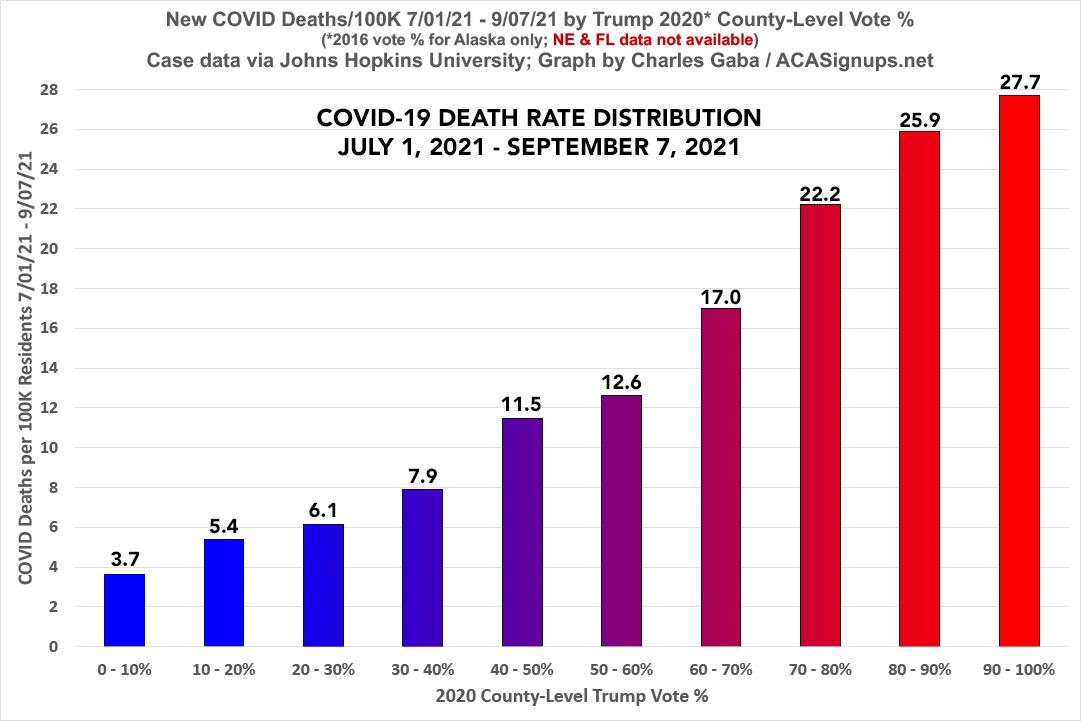
Here's the bar graph with data starting on July 1st, through yesterday (September 7th). The Y-Axis scale is obviously much smaller since the total deaths are much lower, but the trendline is far more stark: Since the beginning of July, the death rate in the reddest counties has been as much as 7.6x higher than in the bluest counties:
Given the dramatic increase in the Red/Blue trendline since the beginning of the Delta variant, I'm assuming the ratios are even more starkly divided:
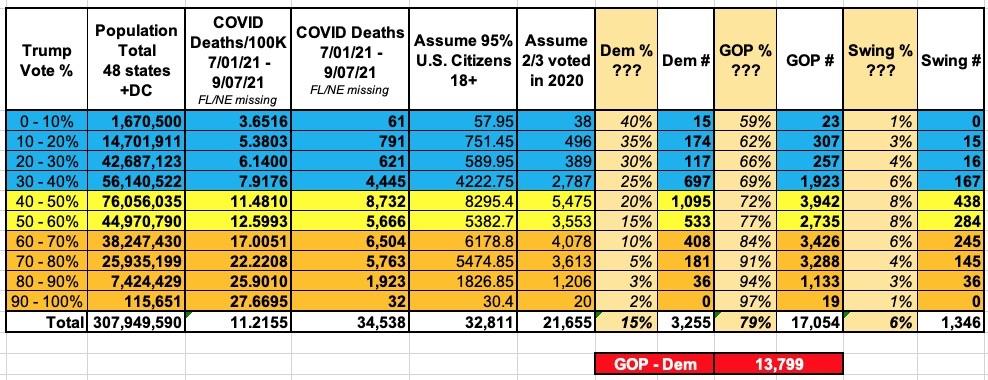
Again, assuming this is reasonably close, it would mean something close to 13,800 more Republican voters have died over the past 2 months or so than Democrats nationally.
As for Nebraska and Florida: Again, I'm reluctant to include this in the table above, but if you put a gun to my head I'd say the "net GOP voter deaths" since 6/30 would be around 4,000 higher if both of these states were included; call it perhaps ~18K more GOP than Dem voters having died of COVID since the end of June.
If so, that'd be a total of perhaps 55,000 more so far this cycle (~146K GOP, ~91K Dem, ~20K Swing/Indy).
What about going forward between now and November 2022?
That's mostly an unknown, of course...but the biggest unknown is the total number of additional COVID deaths the nation is facing between now and then.
Let's assume it ends up being something like 150,000 more Americans dying of COVID between now and then, at roughly the same ratios as in the June - September data above (that is, roughly 80% GOP & 15% Dem). That would boil down to something like 74,000 additional Republican voters and 14,000 additional Democratic voters, for a net loss of 60,000 more GOP than Dem voters nationally.
The grand total would then stand at somewhere around ~105,000 Democratic voters, ~220,000 Republican voters and ~26,000 swing voters having died nationally between 11/04/20 - 11/08/22...or a net loss of perhaps 115,000 more Republicans than Democrats overall.
Now, you would think that this would cause Republican leadership to be deeply concerned...but they clearly aren't.
Why not?
In 1991, there was a great little courtroom drama directed by Michael Apted called "Class Action" starring Gene Hackman and Mary Elizabeth Mastrantonio:
The story is about a lawsuit concerning injuries caused by a defective automobile. The suit takes on a personal dimension because the injured plaintiff's attorney, Jedediah Tucker Ward discovers that the automobile manufacturer's attorney is his estranged daughter Maggie Ward.
...The auto manufacturer in the film also utilizes a "bean-counting" approach to risk management, whereby the projections of actuaries for probable deaths and injured car-owners is weighed against the cost of re-tooling and re-manufacturing the car without the defect (exploding gas tanks) with the resulting decision to keep the car as-is to positively benefit short term profitability.
Class Action's plot wasn't technically based on the infamous Ford Pinto scandal, but it sure as hell is analogous to it.
There's a particularly chilling scene in which Mastrantonio's character, who's actually defending the auto company in the lawsuit, privately asks one of the safety test executives at the company (played by Fred Dalton Thompson) why they didn't simply replace the faulty part in the first place:
Maggie: May I ask a question, please?
Getchell: Sure.
Maggie: Why didn't you just change the blinker circuit? It's just a question.
Getchell: I told Flannery about the problem a month or so before he died. He called in his head bean counter.
Maggie: What's that? Risk management expert, right?
Getchell: Yeah. Flannery shows him the data and asks him how much it would cost to retrofit...
Maggie: You mean recall?
Getchell: Yeah, you got it. To retrofit 175,000 units. Multiply that times 300 bucks a car, give or take. You're looking at around $50 million.
So the risk guy, he crunches the numbers some more. He figures you'd have a fireball collision about every 3,000 cars.
That's 158 explosions. Which is almost as many plaintiffs as there are. These guys know their numbers.
So you multiply that times $200,000 per lawsuit. That's assuming everybody sues and wins. 30 million max.
See? It's cheaper to deal with the lawsuits than it is to fix the blinker.
It's what the bean counters call a simple actuarial analysis.
This is perhaps the most cynical thing I've ever typed in a blog entry, but there's no getting around it:
GOP leadership, FOX News, Trump/MAGA etc don't appear to care how many of their own voters die as long as they damage President Biden's approval rating in the process.
While I'm sure they'd much rather every person who dies of COVID be a Democrat, losing ~250,000 of their own supporters appears to be a small price to pay if it results in them flipping control of the House and/or Senate next year.
Furthermore, while that may sound like a high number, keep in mind that most of those either live in counties (and therefore, indirectly, districts) which are already pretty Blue or in counties/districts which are solidly Red to begin with. A GOP Congressperson used to winning with 75% of the vote isn't going to lose much sleep over that number being knocked down to 70% or even 65%.
There may be a handful of swing districts which will be decided by just a few hundred votes where it ends up making a difference...but if losing 115,000 more GOP voters results in, say, 500,000 independent/swing voters flipping back to the GOP (or at least not bothering to vote at all) because "Biden said he'd stop the pandemic and he hasn't" etc etc, then that would still result in a net gain for Team Red.
And sure enough (via CNN), so far it's playing out exactly as they're hoping:
An ABC News/Washington Post poll conducted at the end of August found 52% of respondents approve of how Biden is handling the pandemic, a 10-point drop from June. Still, more respondents said they approved of his handling of Covid than disapproved.
At the same time, Biden's overall approval has slipped into negative territory amid a chaotic withdrawal from Afghanistan and the Delta variant's drag on the economic recovery. The President's aides view combating the pandemic as the single most important issue of his presidency, and the one that will determine his political fate.
Get vaccinated. Wear a mask.
To retrofit 175,000 units. Multiply that times 300 bucks a car, give or take. You're looking at around $50 million.
So the risk guy, he crunches the numbers some more. He figures you'd have a fireball collision about every 3,000 cars.
That's 158 explosions. Which is almost as many plaintiffs as there are. These guys know their numbers.
So you multiply that times $200,000 per lawsuit. That's assuming everybody sues and wins. 30 million max.
See? It's cheaper to deal with the lawsuits than it is to fix the blinker.
It's what the bean counters call a simple actuarial analysis.
UPDATE: Someone found the exact scene in question on YouTube; it's not great quality but it drives home the point. Ironically, former GOP Senator Fred Dalton Thompson plays Getchell:
Advertisement
