

Weekly Update: U.S. #COVID19 vaccination levels by COUNTY & Partisan Lean
Tue, 08/31/2021 - 8:24pm
Methodology reminders, including some important updates:
- I go by FULLY vaccinated residents only (defined as 2 doses of the Pfizer or Moderna vaccine or one dose of the Johnson & Johnson vaccine).
- I base my percentages on the total population, as opposed to adults only or those over 11 years old.
- For most states + DC I use the daily data from the Centers for Disease Control, but there are some where the CDC is either missing county-level data entirely or where the CDC data is less than 90% complete at the county level. Therefore:
- For Hawaii, Vermont, Virginia and West Virginia, I'm using data from the COVID Act Now Risk & Vaccine Tracker database.
- For Colorado, Georgia, New Mexico and Texas, I'm using their COVID vaccine dashboards set up by the state health departments.
- For California, I'm using the CDC data for most counties and the state health dept. dashboard data for the 8 small counties which the CDC isn't allowed to post data for.
- For Massachusetts, I'm using the CDC data for most counties but am now using the official Massachusetts Health Dept. weekly data report for Barnstable, Dukes & Nantucket counties, which the CDC only has partial data for.
- NEW: I discovered that there's several additional states where the state health department dashboard data seems to be more comprehensive and accurate than the CDC data, including Illinois, Minnesota and North Carolina. I've switched to these states health department reports starting today.
- The 5 major U.S. territories don't vote for President in the general election, preventing me from displaying them in the main graph, but I have them listed down the right side.
- AS NOTED RECENTLY, county populations are now based on official 2020 U.S. Census Bureau data
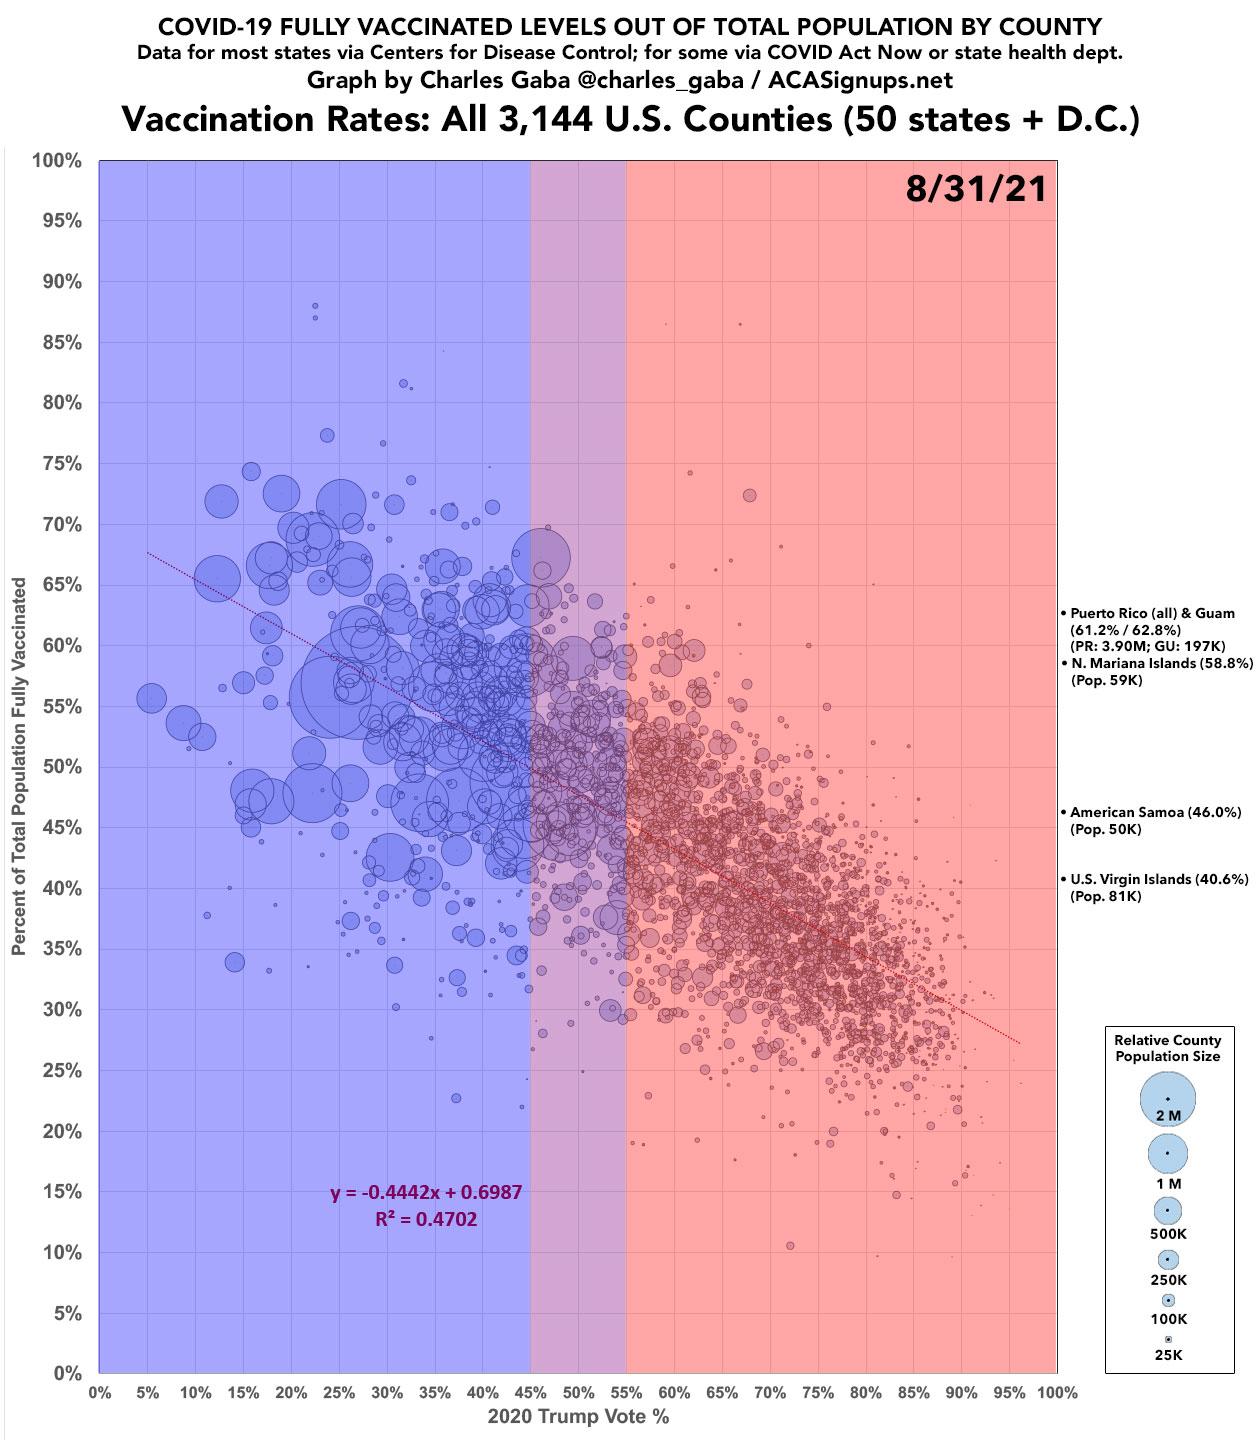
With all this in mind, here's what things looked like as of August 31st, 2021:
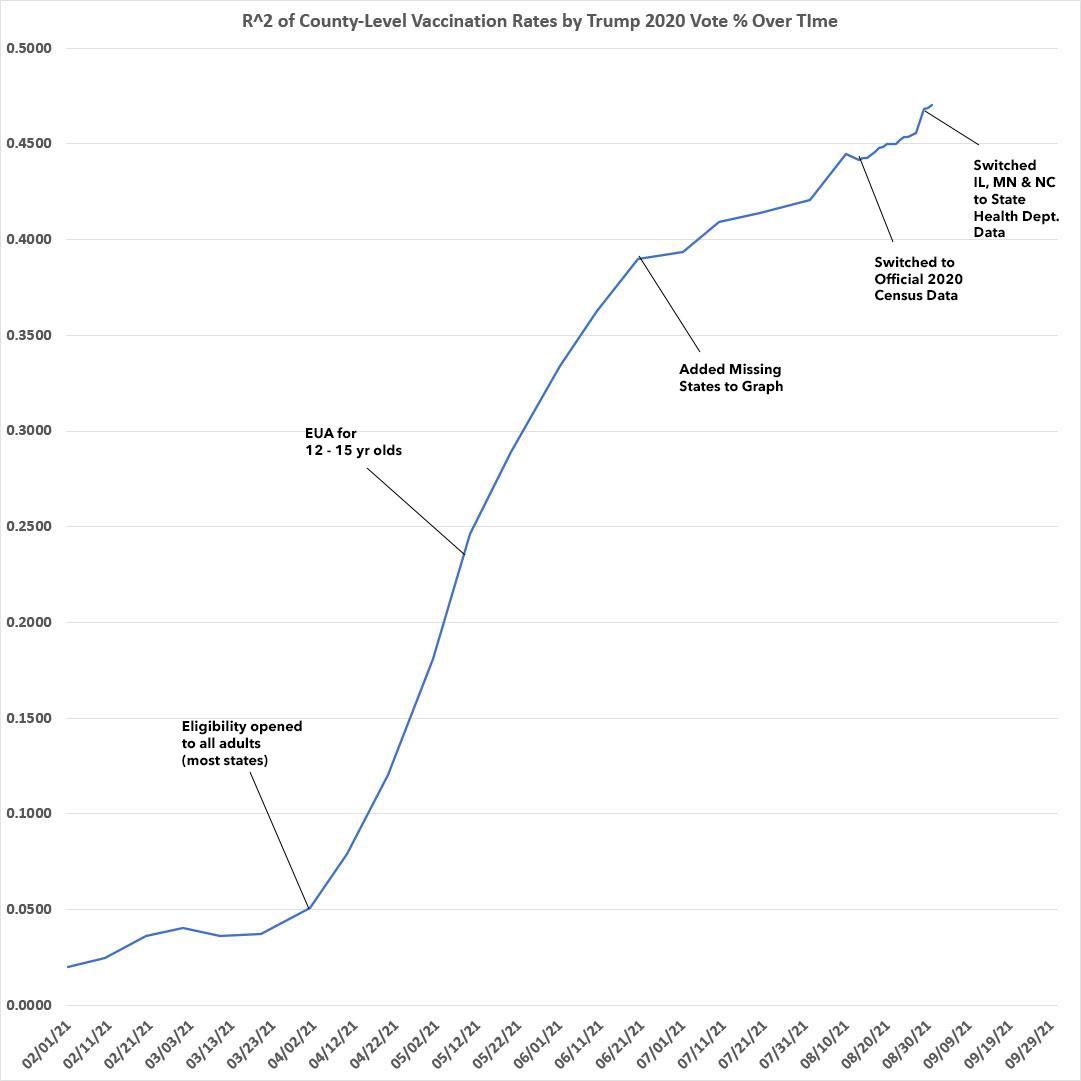
It's also important to note that while there was a very slight, one-time drop in both the R2 (correlation) and slope formulas a two weeks ago when I switched from 2019 estimated population data to official 2020 U.S. Census data for every county, this drop has since reversed itself and continued its gradual climb higher on both the correlation and slope fronts:
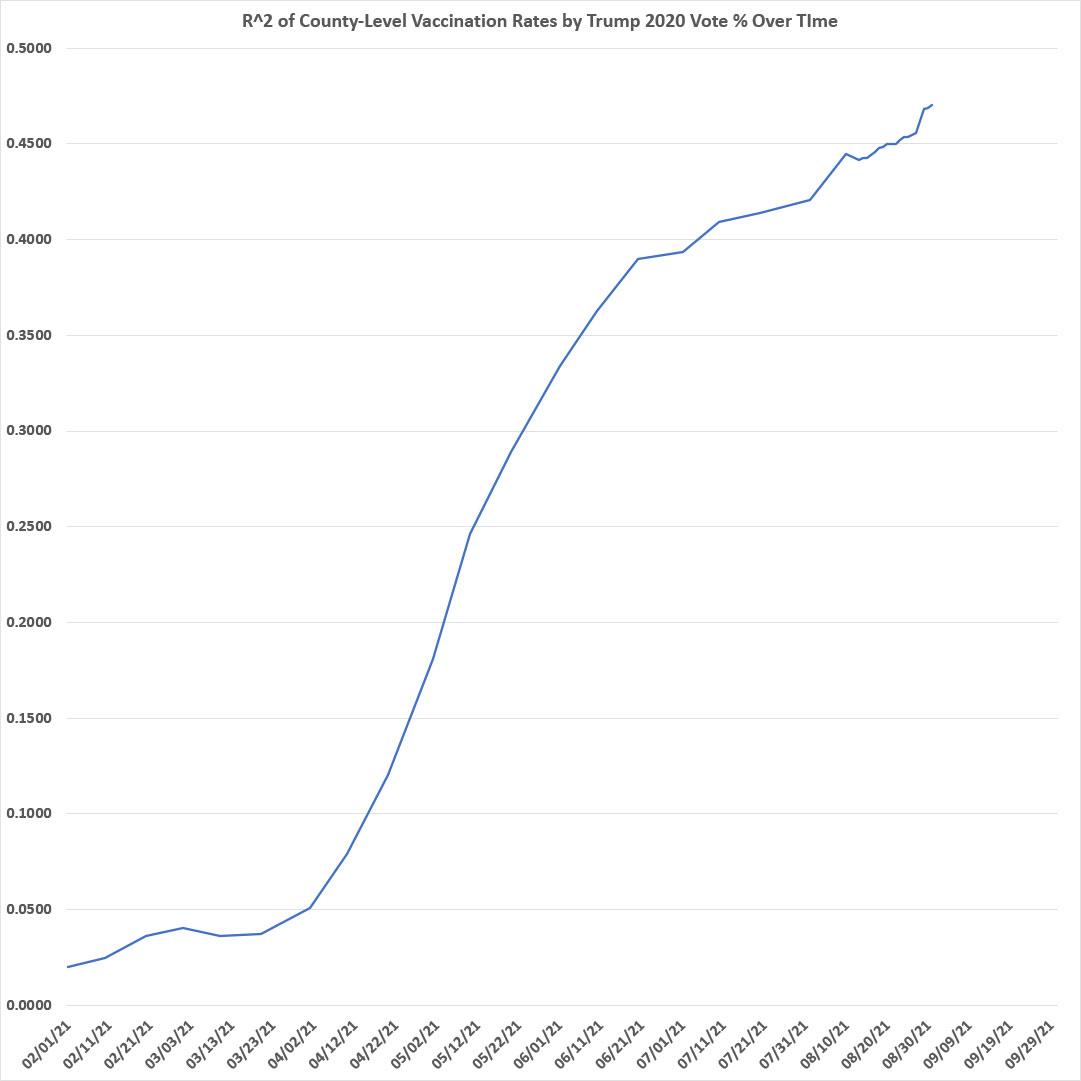
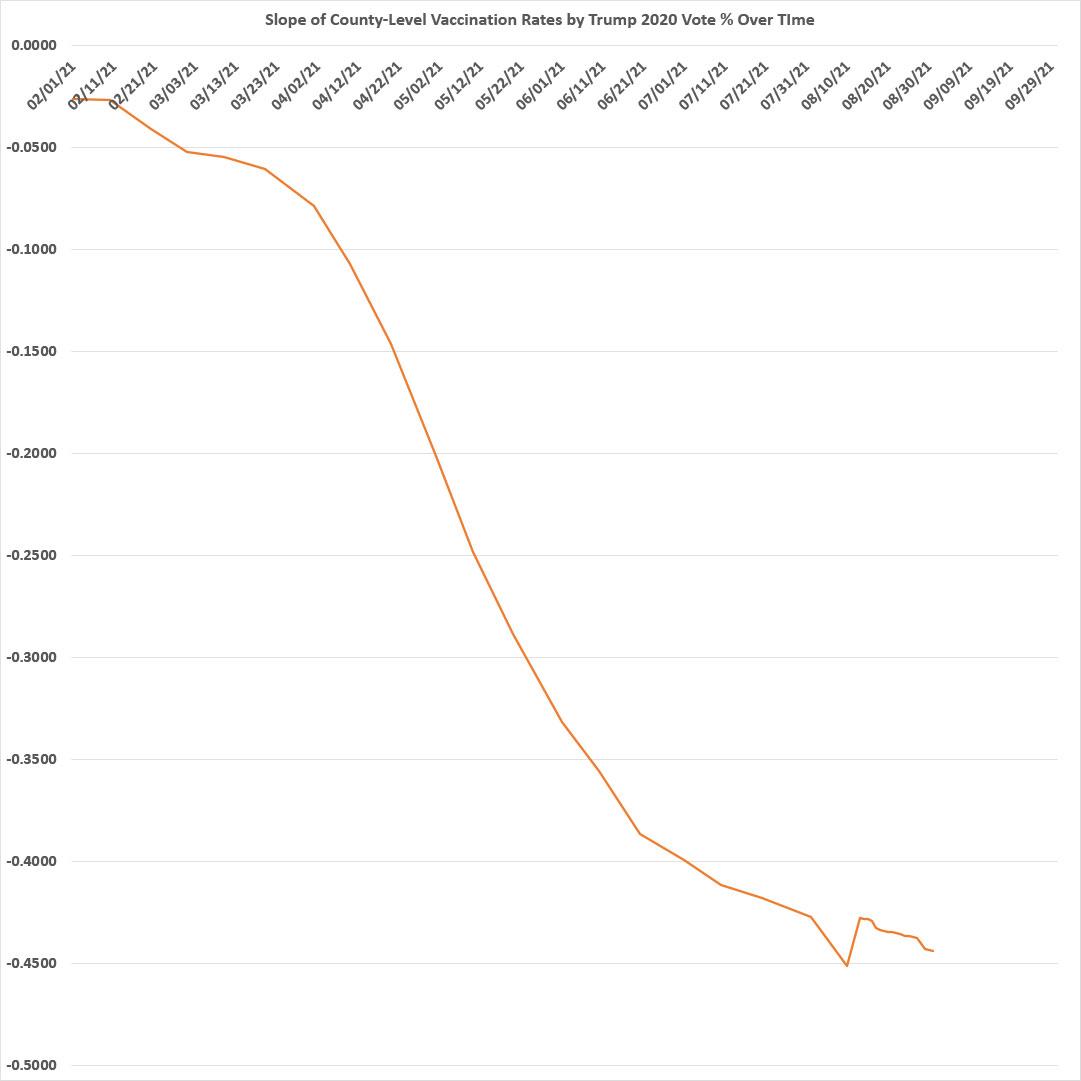
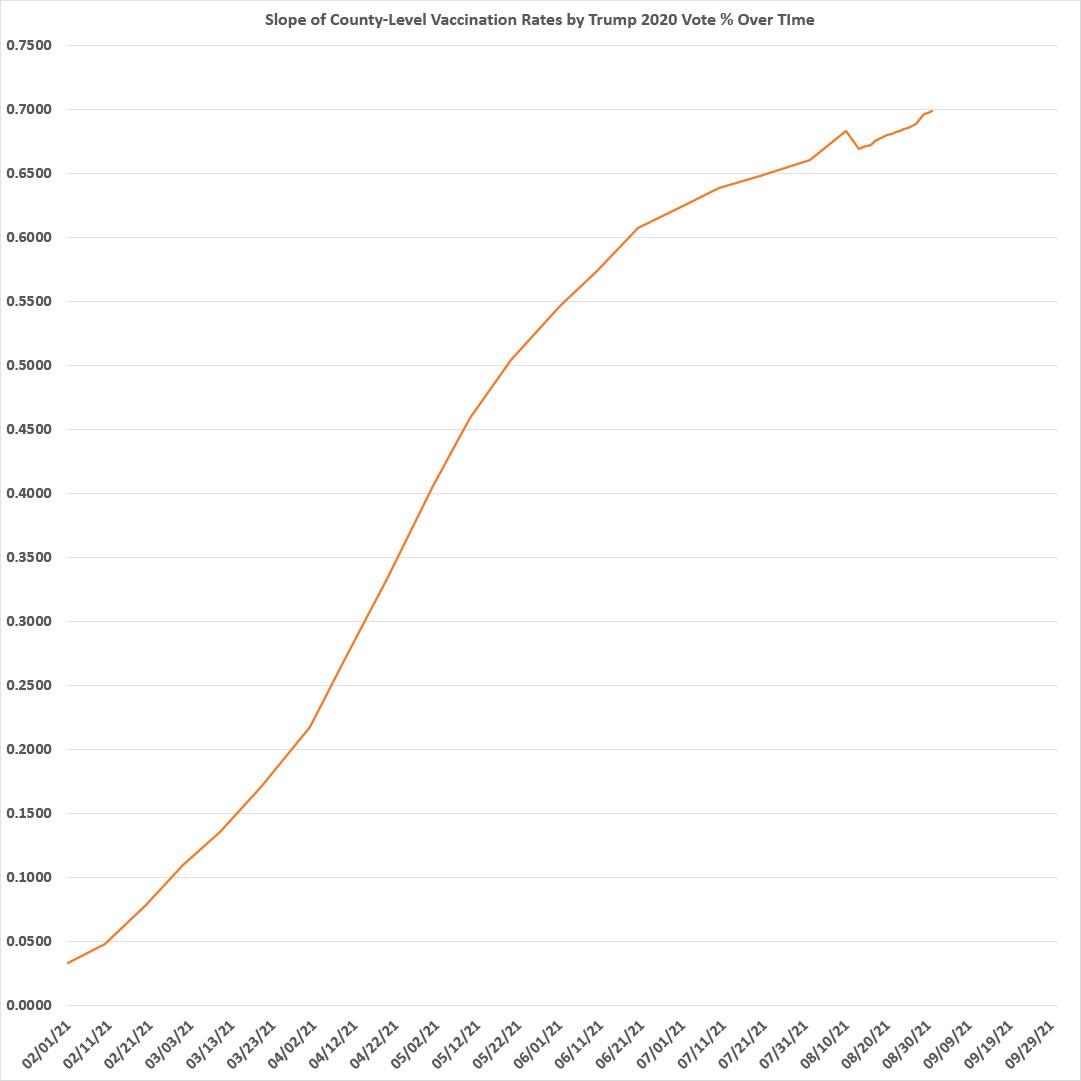
It's worth noting that both the increase in correlation (R2) as well as the angle (Slope) have sped up and slowed down almost perfectly in line with some key events as well as my methodology changes:
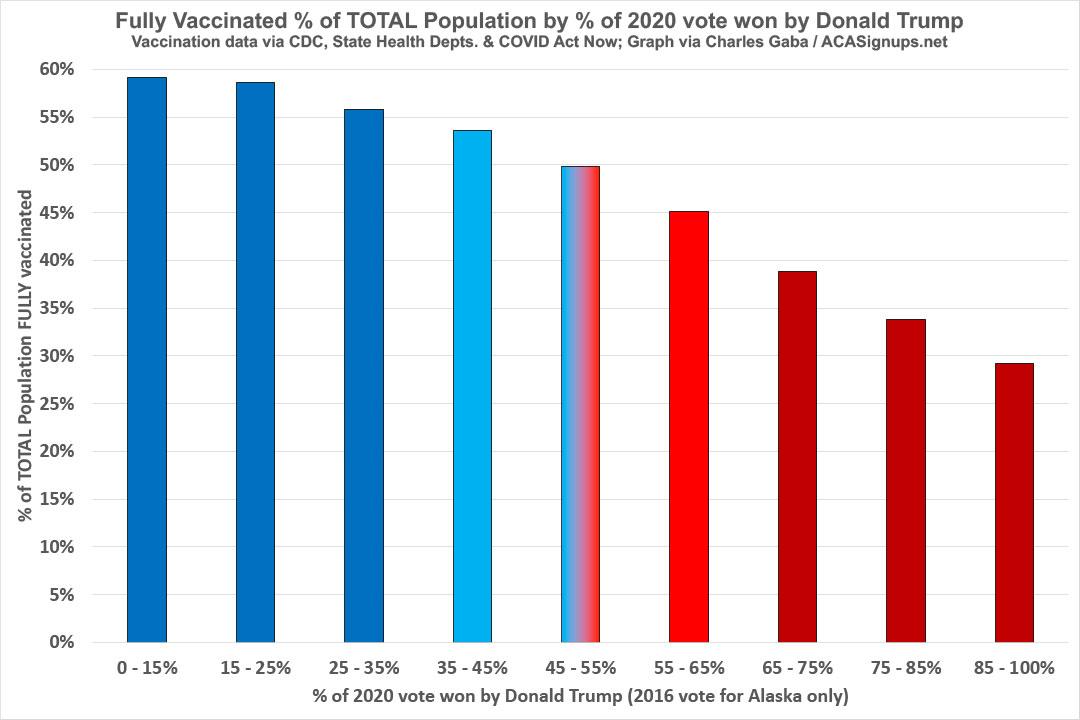
Here's another view: I've broken out every county by Trump vote percent in 10-point increments (15-point ranges at the lower & upper ends since there's so few people at those extremes):
Other things especially worth noting:
- Kalawao County, HI (pop. 82) is still the only one which is 100% vaccinated.
- The only other counties which have fully vaccinated at least 80% of their total populations are:
- Dukes County, MA (pop. 20,600)
- Nantucket County, MA (pop. 14,255)
- Bristol Bay Borough, AK (pop. 844)
- Hudspeth County, TX (pop. 4,886)
- San Juan County, CO (pop. 705)
- Santa Cruz County, AZ (pop. 47,669)
- Presidio County, TX (pop. 6,131)
- At the opposite end, there's still 2 counties below 10% fully vaccinated: McPherson County, SD (pop. 2,411) and Slope County, ND (pop. 706).
- Of counties with more than 100,000 residents, the top-vaxxed is Orange County, NC (77.3% vaxxed); Marin County, CA (74.3% vaxxed); Montgomery County, MD (72.5%); and Sumter County, FL (72.4% vaxxed).
Sumter County is a solid red county...but it's also famously (or infamously?) home to The Villages, the massive retirement community where Trump held rallies last summer.
- Of counties with more than 100,000 residents, the least-vaxxed are Shelby and Limestone Counties, AL, neither of which has vaccinated more than 27% of their total populations.
- There are 49 counties with more than 1 million residents. Of those, the highest-vaxxed is Montgomery County, MD (72.5% vaxxed) while the lowest-vaxxed is Wayne County, MI (home of Detroit), which has only vaccinated 42.6% of its population.
Advertisement
