

2018 Rate Hikes
The 2018 Rate Hike Project: (SCROLL DOWN FOR CHARTS/TABLES)
Back in 2015, I started tracking the individual market premium rate changes (mostly increases, occasionally a decrease) being requested by the various health insurance carriers on a state-by-state basis. At the time, I didn't bother separating out the initial requested rate hikes from the final, approved changes, so my final estimates ended up being a mixture of each. .Even so, I ended up being pretty damned accurate: I estimated that nationally, the overall average, unsubsidized, individual market policy rate increases would be roughly 12-13%, assuming 100% of current enrollees were to re-enroll in the exact same policy. I noted, however, that due to the likelihood of many people switching to different policies (either via the same carrier or a different one), the odds were that the effective average rate increases would turn out to be somewhat lower; likely "under 10% overall".
As it turned out, I called it pretty closely: The overall average approved rate hikes on the indy market (again, for unsubsidized enrollees) ended up being around 11.6-11.7% nationally...slightly below my estimates. Furthermore, the effective average rate hike once the dust settled turned out to be around 8% overall.
For 2016, I started the Rate Hike project earlier in the year, and made sure to add an extra column so I could compare the initial requested rate increases to the final, approved rate hikes...although it really didn't make much difference. While there were a lot of changes over the course of the summer/fall in 2015, in 2016, the approved rate changes ended up being pretty close to those requested in most instances. In the end, I estimated roughly a 25% overall national rate increase for unsubsidized enrollees. I also started tracking the small business market averages as well, although I only did this for a handful of states.
Once again, I nailed it pretty closely: The official ASPE report from the HHS Dept. gave the average as roughly 25%, but that only included the 38 states run via HealthCare.Gov; when you added the other 13 states, it dropped a bit to 22% nationally. However, that only included benchmark plans (the 2nd-lowest-priced Silver plans in each rating area). When you also roll in all the other policies available on the ACA-compliant indy market (Bronze, Gold, Platinum, Catastrophic and other Silver plans), it did indeed end up averaging closer to 25% after all.
This has become something of an annual off-season tradition for me; for good or for bad, I seem to spend 3 months of the year tracking exchange enrollments and the other 9 months of the year tracking how much unsubsidized rates for those same policies are going up. I'm once again tracking every state as comprehensively and accurately as I can as each one releases their initial, revised and final/approved rate changes. I'm also going to attempt to do this for the small business market in every state as well if I can, although those will be posted elsewhere if I'm sure I can lock them in for all (or nearly all) states.
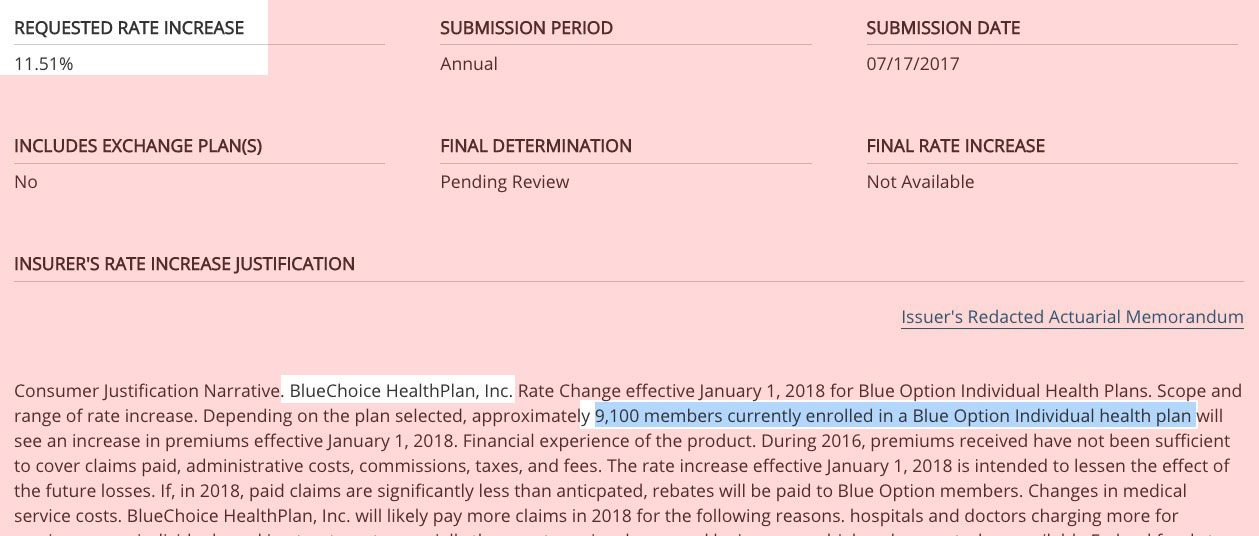
Of course, thanks to the massive Trump/GOP Uncertainty Factor, there's a lot of unknowns at play for next year...and, as I've been predicting for months now, that uncertainty is already clearly leading to significantly higher rate hike requests than would otherwise be asked for. As of this writing I've only documented 4 states (Virginia, Maryland, Connecticut and Vermont), and already at least 4 insurance carriers (CareFirst, Evergreen Health, New Mexico Health Connections and BCBS of Tennessee) have gone on the record as pinning a significant chunk of their requested increases on uncertainty regarding Trump's threat to cut off CSR payments, whether or not HHS Sec. Price will bother enforcing the individual mandate penalty, whether or not the GOP at large will actually repeal the ACA and so on.
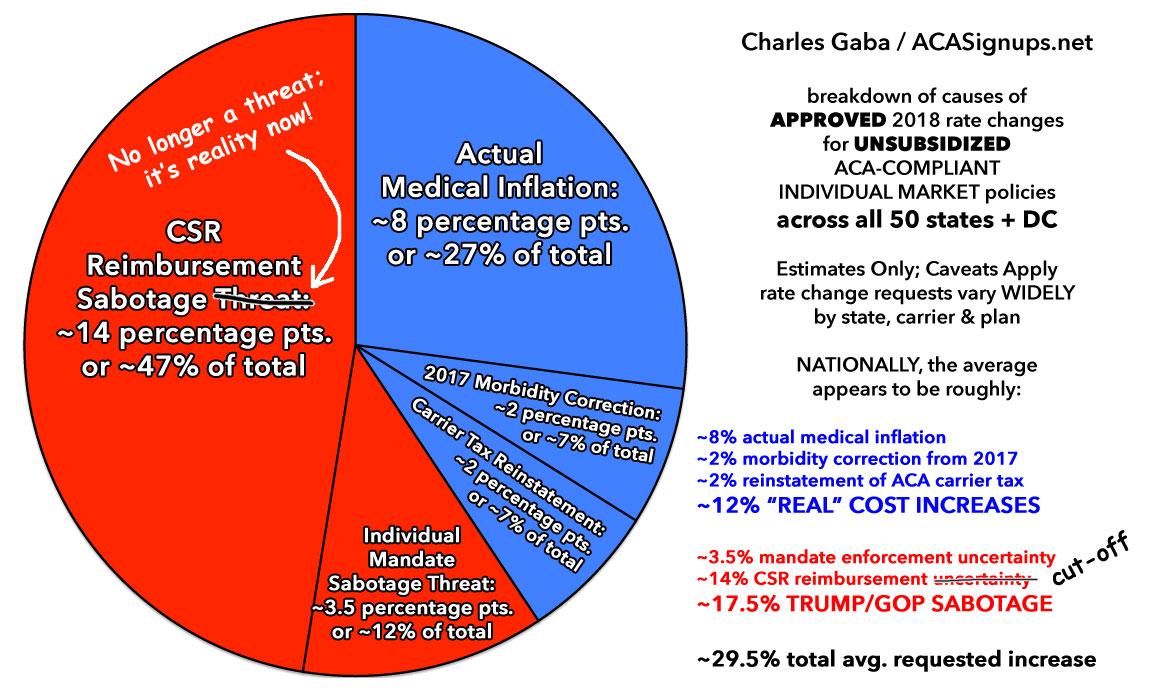
UPDATE 5/25/17: Several carrier CEOs have gone on the record to note that the Trump/GOP Uncertainty Factor is a "significant" or "primary" part of their requested rate hikes this year...but today BCBS of North Carolina went well beyond that, to explicitly say, point blank, that the CSR reimbursement issue is directly responsible for over 60% of their 22.9% requested increase.
I've been assuming a ballpark average of 40% being due to general Trump/GOP/CSR uncertainty as a general rule of thumb. I'm sure it ranges widely from carrier to carrier, and I don't expect many other carriers to be quite so candid and specific about this issue, but BCBSNC has over half a million enrollees on the individual market (on + off exchange). That's 2.8% of the entire indy market all by themselves. Food for thought.
UPDATE 6/02/17: OK, between North Carolina (60% due specifically to sabotage) and Pennsylvania (75% due specifically to sabotage), I'm bumping my ballpark average assumption up to a flat 50% due to the "Trump Uncertainty Tax" in states which don't otherwise specify the impact. I've also added new columns to the tables below which compare the total rate hike requests vs. what they likely would be without the Trump Tax included.
UPDATE 6/7/17: New York has released their rate requests with the opposite situation: They were instructed to assume CSR payments/etc will continue, which means they're only providing the "NO Trump Tax" scenario. In these cases I'm going to rely on the Kaiser Family Foundation, which estimated that rates would have to be increased an average of 9-27% depending on the state, averaging around 19% overall, 21% for non-Medicaid expansion states and 15% for Medicaid expansion states.
FURTHER UPDATE: Just realized that due to the BHP programs in NY/MN, those states only have 1/3 as many CSR enrollees anyway, so the Trump Tax is likely more like 5 points instead of 15 points in each. Tables revised below.
In any event, as always, it's important to remember several key caveats when reading the tables below:
- These are for the individual health insurance market ONLY. Thes do not have anything to do with employer-sponsored policies (large or small), Medicare, Medicaid, the VA/TriCare, short term policies or "grandfathered/transitional" policies. These only refer to the roughly 18 million people enrolled in ACA-compiant individual market policies, either on or off the exchanges.
- The requested rate changes are oftentimes reduced (and, unfortunately, occasionally increased) by state insurance regulators. Sometimes they're approved exactly as is. Sometimes the carrier submits a revised request later in the summer/fall which is in turn approved or changed again. The green column at the end (APPROVED) likely won't be filled in for any states until sometime in October.
- These are the full price, unsubsidized rate changes. For roughly 9 million exchange enrollees who are receiving APTC assistance, assuming their income level, etc. doesn't change much and they remain on the same policy, they likely won't see their rates go up much at all, since the tax credits will likely increase to match in most cases. The rate changes below apply mainly to the other 9 million people on the indy market who aren't receiving APTC assistance.
- These average increases assume 100% of current enrollees renew their existing policy in 2018. This, obviously is not going to be the case for millions of people no matter what happens. Some carriers are dropping out of the market altogether. Some are dropping certain plans. Some are changing their policy offerings. Some are newly entering the individual market. In addition, the individual market has always had a lot of churn anyway, with people jumping in and out from year to year. Since there's no real way of accounting for all of that, I do the best I can with what I have at my disposal.
With all that in mind, here's where things stand as of 5/14/17: With 4 states plugged in (CT, MD, VT & VA) representing less than 6% of the total population, carriers are requesting a pretty unpleasant 32.5% average rate hike.
This will likely change dramatically as each new state is added to the spreadsheets. Once states representing over half of the population have been entered, it will take increasingly dramatic variances for each new state to move the needle up or down. Updates will be added at this link.
And with that, we're off...
UPDATE 5/16/17: OREGON ADDED. There are now 5 states representing around 7.1% of the total population included, with a weighted average requested rate hike of 29.84%.
UPDATE 5/19/17: DISTRICT OF COLUMBIA ADDED. There are now 6 states (DC is treated as a state here) representing 7.3% of the total population included, with a weighted average requested rate hike of 29.75%.
UPDATE 5/25/17: NORTH CAROLINA ADDED. There are now 7 states representing 11.2% of the total population included, with a weighted average requested rate hike of 27.5%.
UPDATE 6/2/17: PENNSYLVANIA ADDED. There are now 8 states representing 14.8% of the total population included, with a weighted average requested rate hike of 29.7% with the Trump Tax or 11.0% without it.
UPDATE 6/7/17: NEW YORK ADDED. There are now 9 states representing 18.3% of the total population included, with a weighted average requested rate hike of 30.4% with the Trump Tax or 11.9% without it.
UPDATE 6/9/17: MAINE ADDED and CONNECTICUT CORRECTED. There are now 10 STATES representing 18.8% of the total population included, with a weighted average requested rate hike of 13.1% WITHOUT the Trump Tax or 34.2% WITH it.
UPDATE 6/14/17: DELAWARE and MICHIGAN ADDED. There are now 12 STATES representing 21.8% of the total population included, with a weighted average requested rate hike of 13.7% WITHOUT the Trump CSR Tax or 33.1% WITH it.
UPDATE 6/19/17: WASHINGTON STATE ADDED. There are now 13 STATES representing 23.8% of the total population included, with a weighted average requested rate hike of 13.3% WITHOUT the Trump/GOP Sabotage Tax or 32.2% WITH it.
UPDATE 6/20/17: IOWA ADDED. There are now 14 STATES representing 24.6% of the population included, with a weighted average requested rate hike of up to 13.6% WITHOUT the Trump/GOP Sabotage or 32.6% WITH the Trump/GOP Sabotage Tax included.
ALSO NOTE: Going forward, I'm changing the "WITHOUT TrumpTax" label to "w/PARTIAL TrumpTax" because some carriers don't break out their "HHS mandate enforcement uncertainty" factor even if they break out the "assume no CSR reimbursements" factor. This means that the "Without" average is actually somewhat lower than shown overall, but I have no way of estimating how much lower, though my guess is it'd be perhaps 2 points or so overall.
UPDATE 7/2/17: INDIANA and TENNESSEE ADDED. There are now 16 STATES representing 28.3% of the population included, with a weighted average requested rate hike of up to 13.3% with a PARTIAL Trump/GOP sabotage effect or 31.8% WITH the Trump/GOP Sabotage Tax included.
UPATE 7/6/17: GEORGIA ADDED: There are now 17 STATES representing 31.9% of the population included, with a weighted average requested rate hike of up to 15.1% with a PARTIAL Trump/GOP Sabotage Tax or 34.2% with the FULL Trump/GOP Sabotage Tax included.
UPDATE 7/7/17: RHODE ISLAND ADDED: There are now 18 STATES representing 32.2% of the population included, with a weighted average requested rate hike of up to 15.1% with a PARTIAL Trump/GOP Sabotage Tax or 34.1% with the FULL Trump/GOP Sabotage Tax included:
UPDATE 7/12/17: MONTANA and NEW MEXICO ADDED: There are now 20 STATES representing 33% of the population included, with a weighted average requested rate hike of up to 15.1% with a PARTIAL Trump/GOP Sabotage Tax, or 34.2% with the FULL Trump/GOP Sabotage Tax included:
UPDATE 7/14/17: MICHIGAN UPDATED, COLORADO ADDED: There are now 21 STATES representing 34.7% of the population included, with a weighted average requested rate hike of up to 15.0% with a PARTIAL Trump/GOP Sabotage Tax, or 33.7% with the FULL Trump/GOP Sabotage Tax included:
UPDATE 8/1/17: After a long dry spell stretching over the insane Senate "repeal/replace" brouhaha, the rate filings are back with a vengence: I've added IDAHO (complete), ARIZONA (Blue Cross only) MINNESOTA (rough estimates) and the Big One: CALIFORNIA. I've now tracked 25 STATES representing 51% of the population, with weighted average requested rate hikes of up to 13.4% with NO or PARTIAL Trump/GOP sabotage tax included, or 28.2% with the FULL sabotage tax included:
UPDATE 8/1/17: Well, the floodgates have really opened up today (especially with RateReview.HealthCare.Gov being loaded up for 2018). I've also added ALABAMA, ALASKA and WYOMING. Across 28 states representing I've now tracked 28 STATES representing 53% of the population, with weighted average requested rate hikes of up to 13.2% with NO or PARTIAL Trump/GOP sabotage included, or around 28.1% with the FULL sabotage tax:
UPDATE 8/2/17: The flood continues...I've updated 2 states (Minnesota and North Carolina), while also adding two new ones (ARKANSAS and KENTUCKY). I've now tracked the rate requests for 30 STATES representing 55% of the population. The weighted average rate hike request now stands at 12.8% with NO/PARTIAL Trump/GOP sabotage or 27.5% with FULL Trump/GOP sabotage.
UPDATE 8/3/17: Added WEST VIRGINIA and another Big One: TEXAS. I've now compiled rate request data for 32 STATES representing 65% of the population, As I expected, just as California pulled the national average down several points, Texas has bumped it back up again: The weighted average rate hike request now stands at 13.9% with NO or PARTIAL Trump/GOP sabotage, or around 28.2% with FULL sabotage:
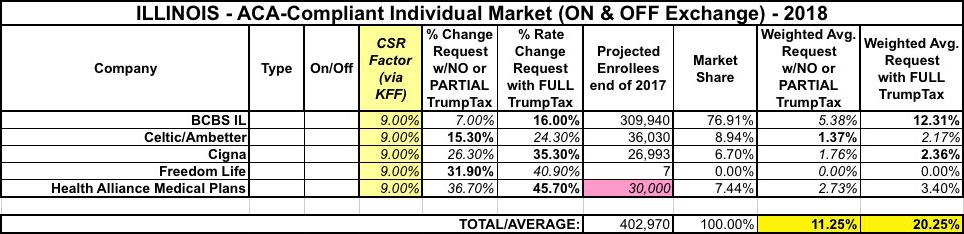
UPDATE 8/3/17: Two updates in one day! I've added HAWAII and ILLINOIS. I've now compiled rate request data for 34 STATES representing 68.5% of the population. The weighted average now stands at 13.8% with NO or PARTIAL sabotage or around 27.9% with FULL sabotage:
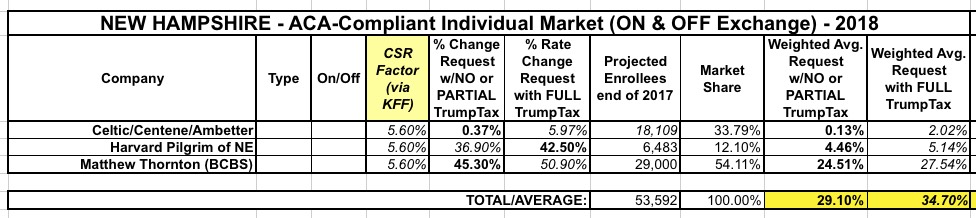
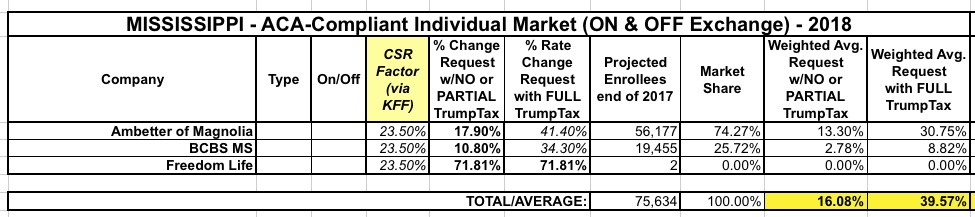
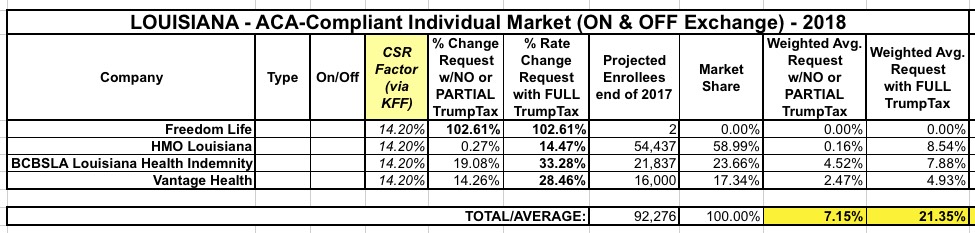
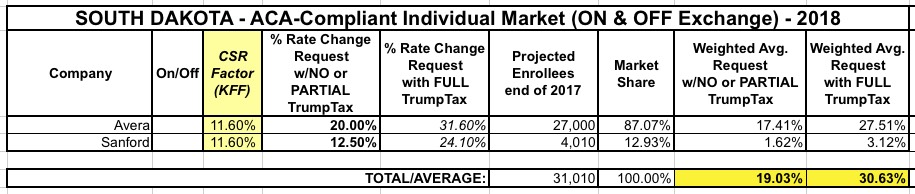
UPDATE 8/7/17: MORE states added: LOUISIANA, MASSACHUSETTS, MISSISSIPPI, NEBRASKA, NEW HAMPSHIRE and SOUTH DAKOTA. I've now compiled rate request data for 40 STATES representing nearly 75% of the population. The weighted average still stands at 13.8% with No/Partial sabotage, but the FULL sabotage average has inched up to 28.0%.
UPDATE 8/10/17: Coming into the home stretch. I've added seven more states: FLORIDA, NEW JERSEY, NORTH DAKOTA, OHIO, OKLAHOMA, SOUTH CAROLINA and WISCONSIN. I've now completed rate request data for 46 states (+DC) representing over 95% of the total population. The weighted average now stands at 14.4% assuming No/Partial Sabotage, or 29.0% assuming FULL Sabotage.
I hope to plug in the final 4 states (Kansas, Missouri, Nevada and Utah) ASAP, but they're unlikely to move the needle by much given that they collectively only make up 5% of the total population.
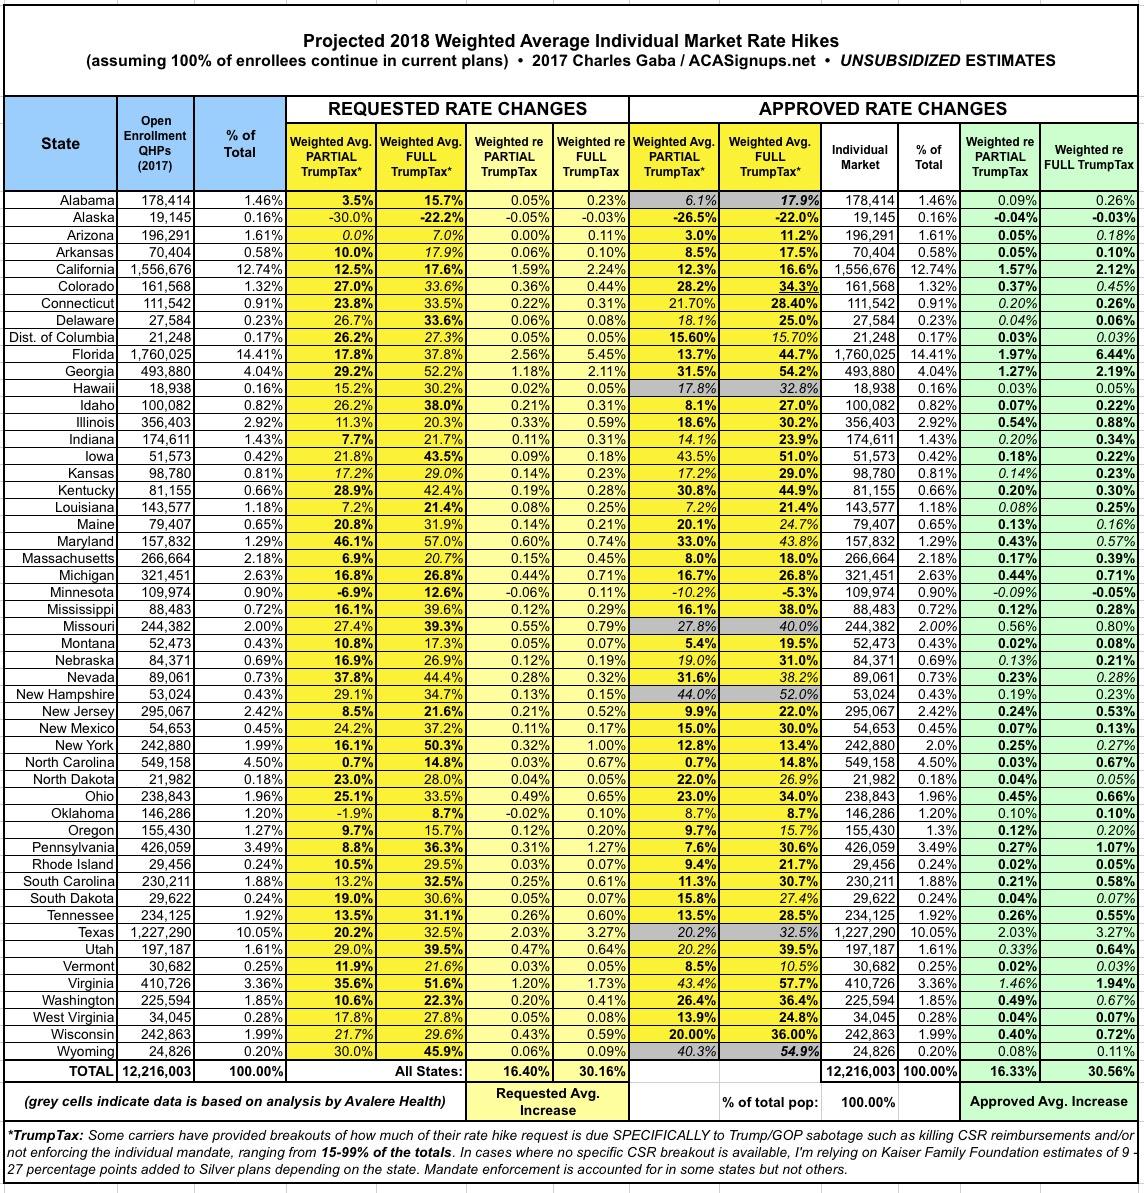
UPDATE 8/14/17: I've started going back and updating/correcting/revising the earlier states, where some carriers have either dropped out, expanded coverage or resubmitted revised filings. So far I've updated Virginia, Maryland, Connecticut, Vermont and Oregon. This has bumped the PARTIAL Sabotage average up by nearly 1 full point, and the FULL Sabotage average up by about 0.5 points:
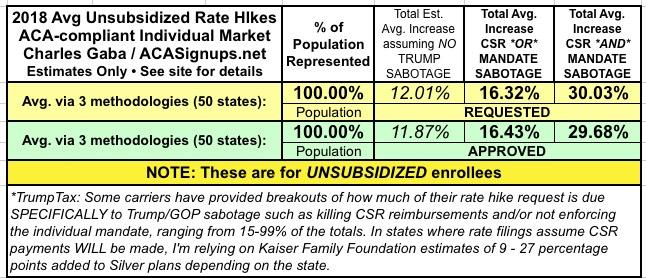
UPDATE 8/20/17: More updates/corrections, to Maine and the District of Columbia. The averages now stand at 15.4% assuming No/Partial Sabotage or 29.5% assuming FULL Sabotage.
UPDATE 8/23/17: New York has posted their approved average rate hikes, making them the 2nd state to do so after Oregon. I'll start posting revised tables including approved increases as soon as a few more state regulators chime in.
UPDATE 9/01/17: Maryland has posted their approved average rate hikes, making them the 3rd state to do so. In addition, Missouri has finally posted their requested rate increases, so I now have compiled requested increases for 47 states +DC and approved increases for 3 states:
UPDATE 9/06/17: I've finally plugged in the requested rate hikes for the final 4 states (Kansas, Missouri, Nevada and Utah)! Note that Kansas is highly questionable, as I only have data for 1 of the 2 carriers participating, and the missing one has most of the market share. I've also gone back and cleaned up a couple of other states with some minor corrections (I had forgotten that VT, DC and MA all merged their individual and small group market risk pools, meaning the CSR factor is lower in each than I had previously estimated). In addition, with four states having released approved rate changes (Oregon, Maryland, New York and now Vermont), I've overhauled the spreadsheets to start including the columns for APPROVED rate changes.
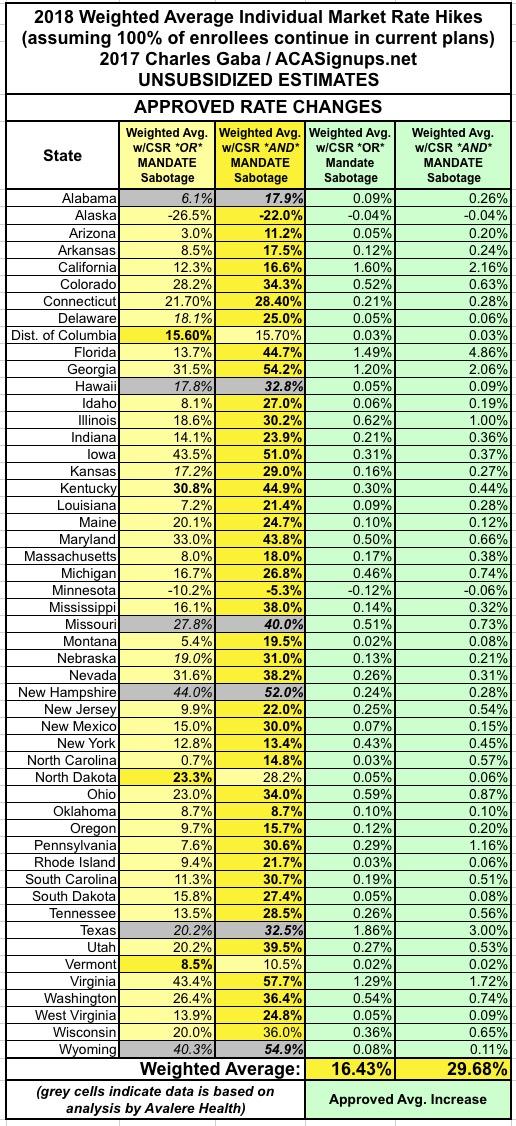
UPDATE 9/06/17 (busy day!): Two more states have released their APPROVED rate hikes (Maine and Colorado). In both cases, one of my assumptions regarding the requested increases turned out to be wrong, so I have do go back and revise those as well. This has resulted in the "No/Partial Trump Tax" average inching its way over the 16% line for the first time (16.1%, actually), and has the "FULL Trump Tax" average hovering very close to the 30% mark.
With approved rates for 6 states now baked in, the "partial sabotage" average stands at 19.4% while the "full sabotage" average is 24.1%...several points higher and lower respectively, with CSR sabotage "only" accounting for about 20% of the average increase. However, it's very important to remember that these states only represent about 9% of the total population; both numbers will almost certainly jump around quite a bit as more states are added to the mix, just as they did when I started adding requested rate changes in.
UPDATE 9/7/17: Bad news out of Virginia and Kentucky; Optima Health is pulling out of a bunch of VA counties and the carriers have all submitted revised "NO CSR!" filings which are generally even higher than the Kaiser Family Foundation had estimated for the state. In addition to opening up the "bare county" problem again, this also had the effect of bumping up both the "partial" and "full" sabotage averages a bit, to 16.2% and 29.8% respectively. Meanwhile, in Kentucky, Anthem is similarly pulling out of about half the state, meaning perhaps 35K enrollees will have to switch plans. This ironically reduces the "average increase" in the state slightly.
UPDATE 9/14/17: Added approved rates in Connecticut, Louisiana and Michigan (MI's aren't officially approved but appear unlikely to change much). I now have approved rates for 9 states.
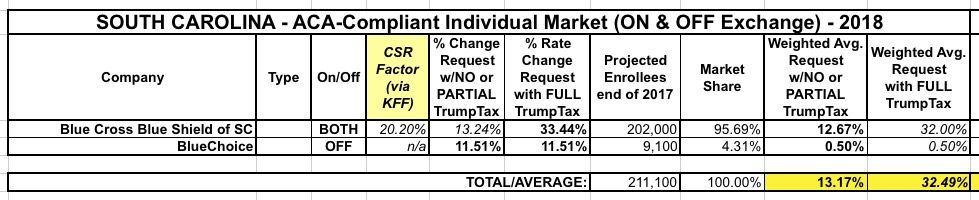
UPDATE 9/27/17: No updates for awhile due to the Graham-Cassidy brouhaha, but with that out of the way and the final 2018 enrollment period contract signing deadling set for tomorrow, several more states have come out with their final, approved rate changes, including Florida, Washington State, Virginia, South Carolina and Mississippi. I now have final rate changes for 14 states representing around 1/3 of the country.
UPDATE 10/01/17: Now that we're past the contract signing deadline (with CSR reimbursements pretty much certain not to be guaranteed next year), the approved rates are popping up pretty quickly: I've added Alaska, Arkansas, Idaho, North Dakota and Tennessee.
UPDATE 10/03/17: I've added two more states today: Minnesota and Arizona. This brings the table up to 22 states representing around 43% of the country.
UPDATE 10/04/17: I've added New Mexico this morning (the numbers are a bit fuzzy but come from the state Insurance Commissioner so should be solid enough to enter).
UPDATE 10/5/17: Thanks to an assist from Protect Our Care, I've managed to plug in the approved rate increases for six more states: Illinois, Indiana, Nevada, Ohio, South Dakota and Utah.
UPDATE 10/5/17: OK, make that seven more today; I've also added Delaware.
UPDATE 10/10/17: I have the approved rates for Kansas, Nebraska and West Virginia, bringing the grand total up to 33 states, but am holding off until I get a few more states added before actually updating the charts/tables below.
UPDATE 10/11/17: BOOM. California has released their statewide weighted average rate increases, both with and without the CSR load. As the largest state in the country, this (along with the small increases from Kansas, Nebraska and West Virginia) brings the total portion of the population represented up to nearly 69% across 34 states.
UPDATE 10/16/17: Pennsylvania has chimed in. That makes 35 sates or 73% of the population accounted for.
UPDATE 10/18/17: Added Montana, North Carolina, North Dakota, Rhode Island and New Jersey. Around 80% of the total population has now been accounted for; the only states left at this point are: Alabama, Hawaii, Iowa, Kentucky, Massachusetts, Missouri, New Hampshire, Oklahoma, Texas, Wisconsin and Wyoming (along with the District of Columbia).
UPDATE 10/24/17: With just a week to go before Open Enrollment begins, I've compiled the approved rate hikes for 3 more states (and the District of Columbia): Kentucky, Massachusetts, Wisconsin. That's 85% of the country accounted for. Eight states left to go.
UPDATE 10/27/17: Just 5 days to go before Open Enrollment begins. I've plugged in the approved rate hikes for 6 more states, including Alabama, Hawaii, Missouri and Wyoming. This accounts for 90% of the total population, leaving just Texas and New Hampshire to go.
UPDATE 10/17/17: OK, for completeness' sake, I went ahead and filled in New Hampshire and Texas, although I'm still waiting on confirmation for some oddities in each state. Still, overall, this should pretty much complete the picture.
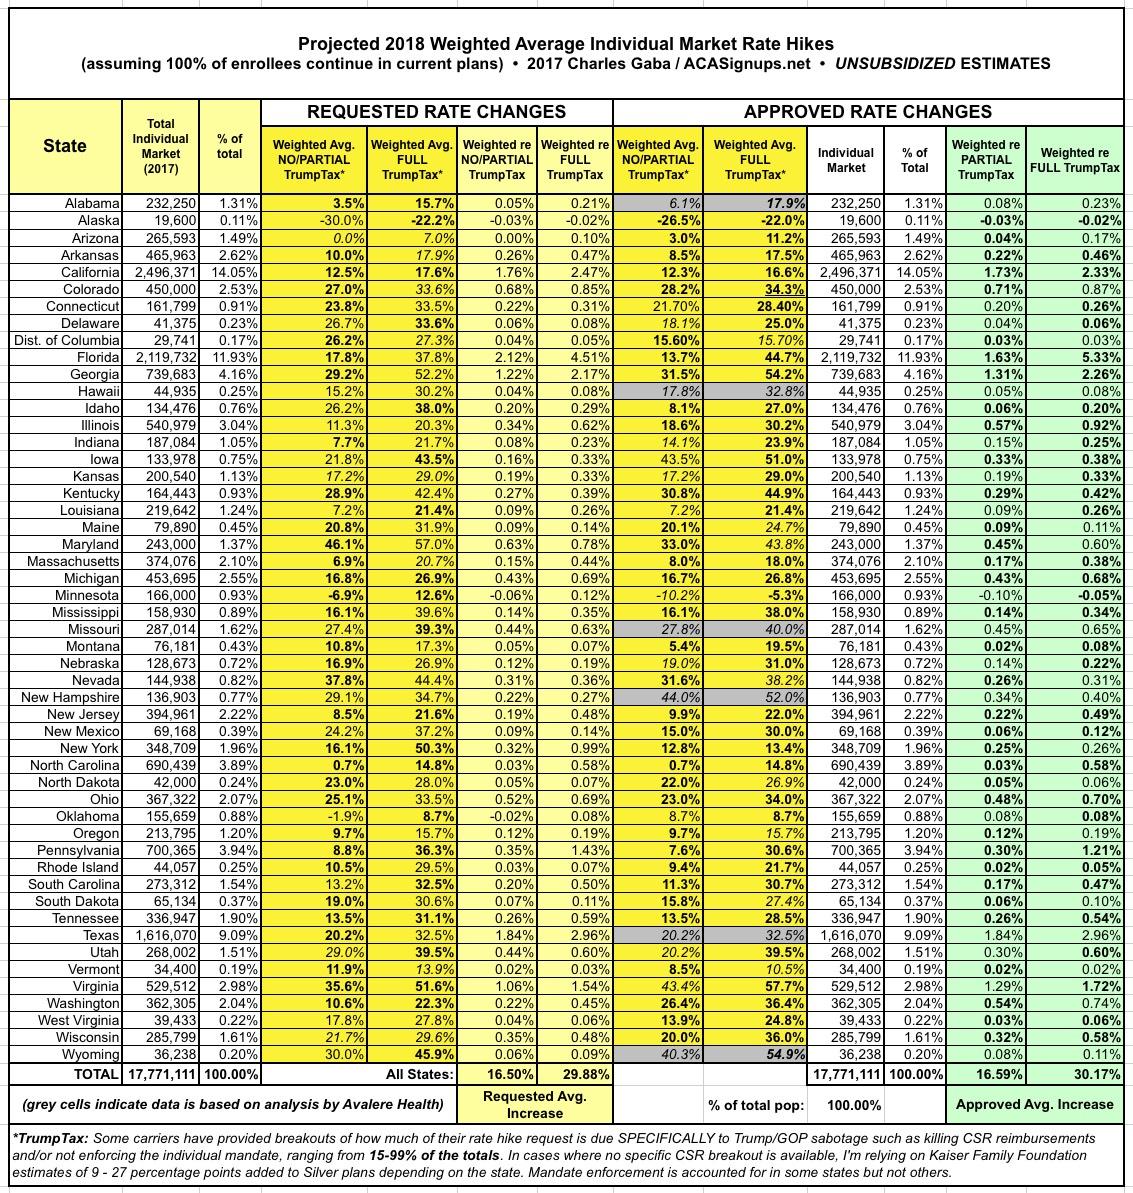
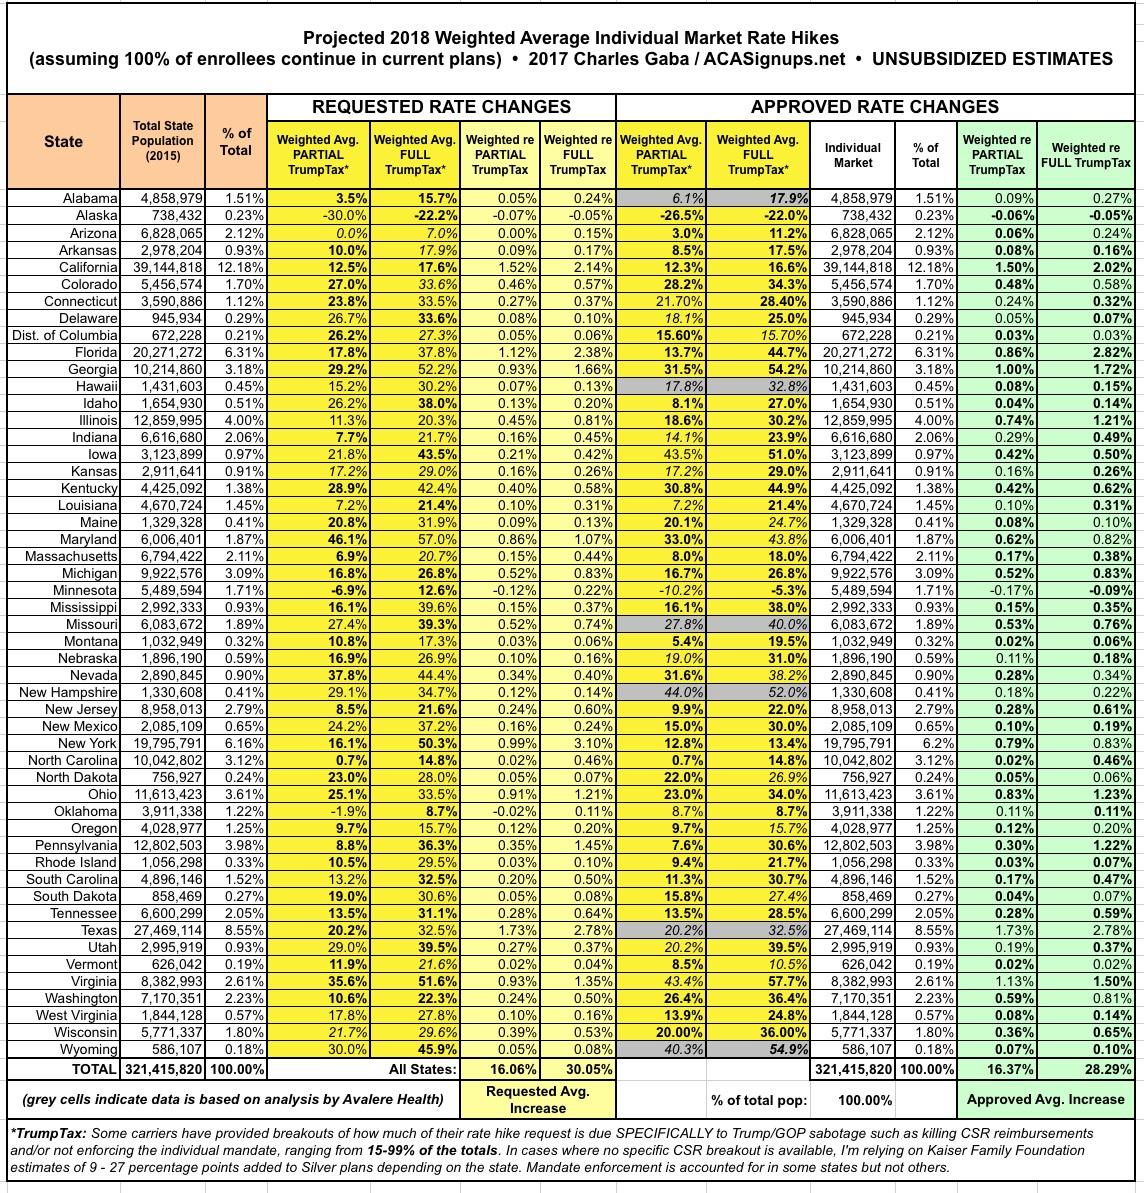
With all of these changes/additions/updates, here's what the overall picture now looks like (click images for full-size versions):

Pages
Advertisement
