

FINAL PROJECTION: 2016 Weighted Avg. Rate Increases: 12-13% nationally*
Thu, 10/15/2015 - 12:34pm
*IMPORTANT: This assumes that everyone currently enrolled sticks with their current policy next year. If enough people shop around and consider their options, the average premiums for various plans, various companies, in vartious states and nationally could end up being considerably lower (possibly coming in under 10% overall).
Again: Do not blindly autorenew! Contact your ACA exchange website/call center (or your insurance carrier, if you're enrolled directly through them) and check out your options before committing to your existing plan! In many cases, there will be a different plan which is a better value for you!
With the addition of Pennsylvania's approved average rate hikes, I've now accounted for 49 out of 50 states, as well as DC. Wisconsin is the only state which doesn't have at least a requested rate change entry. However, with over 98% of the total population covered, it's safe to say that Wisconsin wouldn't move the needle up or down more than a tenth of a percent or so. At this point the only factor which is likely to change any of the state-level averages is if the state insurance commissioners/regulators change the rate increases (or decreases) for individual plans or companies.
UPDATE 10/25/15: I've finally gone ahead and completed the set by adding Wisconsin...with major caveats. Colorado has also been updated with approved rate hikes (9.8% vs. 13.1% requested). As I figured, however, neither of these updates changed things much nationally; it's still 12-13% on average overall.
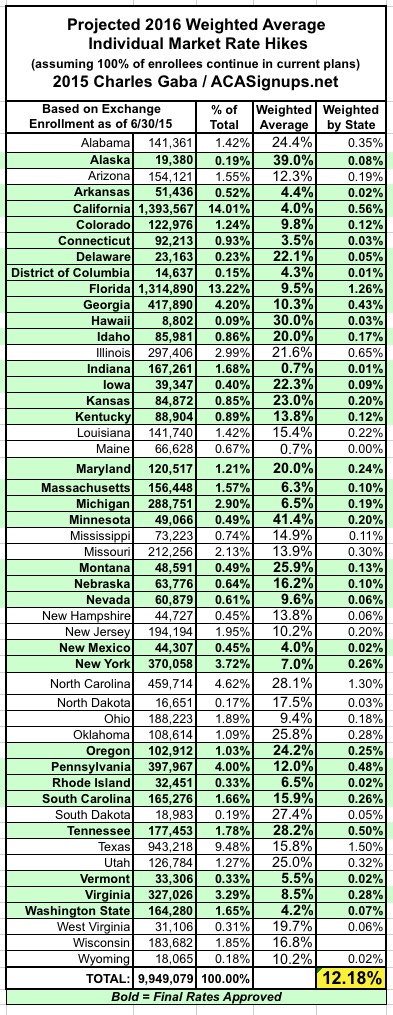
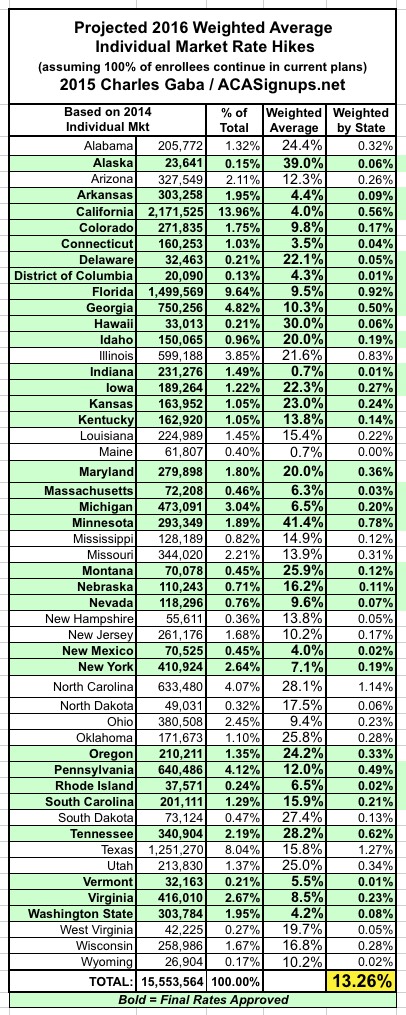
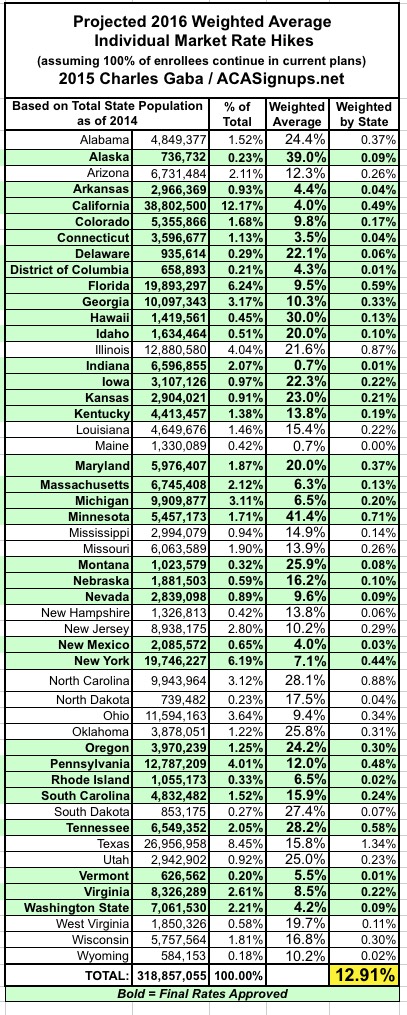
As a reminder: What I've done here is to take the overall weighted average 2016 rate increases for the ACA-compliant individual health insurance market for each state (requested in some states, approved in others) and plug those into a spreadsheet. Then, I've further weighted each state's average increase by that state's percentage of the national total, using 3 different criteria: Total Individual Market (as of 2014); ACA Exchange Enrollment Size (as of March 2015); and Total State Population Size (as of 2014). Again, the bold-faced/green states are ones where the 2016 rates have been approved; the rest are still requested only and could change dramatically in some cases.
NOTE: Links to many of the individual state estimate posts here.
Again, some important caveats:
- Many of the states are only partly weighted and include educated guesses/assumptions about the total individual enrollment risk pool size or market share for individual companies.
- 19 states have requested rate changes only, not approved ones; the final, approved rates could end up being quite different in some cases.
- If you want to see the number-crunching for the individual states, use the "State" drop-down menu on the right-hand side of the website (or scroll down below the main site to find it if you're using a smartphone).
With all that in mind, as of October 25th, no matter how I slice it, the national weighted average increase for 2016 seems to be somewhere between 12% - 13%.
Advertisement
