

Did I overestimate 2017 avg unsubsidized rate hikes?? Nope.
Tue, 10/25/2016 - 9:17am
For the past month or so, dozens of news stories across the political ideological spectrum have cited my estimate of the national weighted average individual market rate hikes for 2017...usually listed as 24-25%, depending on the exact date they went to press (the number has moved around slightly as additional state data has come in; it currently sits at 25.6%, although I expect it to drop back below the 25% mark once the remaining 5 states are plugged in).
However, yesterday's press releases from the HHS Dept., along with the official ASPE Health Plan Choice and Premiums in the 2017 Health Insurance Marketplace report has caused a bit of understandable confusion. Kevin Drum over at Mother Jones mentions both ASPE's 22% figure along with my own 25% estimate:
The federal government announced today that Obamacare premiums are set to rise 22 percent next year. Charles Gaba estimates that premiums will go up 25 percent. Those numbers are close enough that there's probably no need to dive into the weeds to see if there are any gotchas. Premiums really are going up an average of about 25 percent next year. Here are five things to keep in mind:
Drum is absolutely correct that there's not really enough of a gap between the numbers to matter much; the larger point is that yes, unsubsidized rates are indeed going up quite a bit more than the previous two years overall.
However, given how much work I've poured into this project over the summer and fall, the variables involved (partial/out of date data, etc) and the fact that so many media outlets have been citing my work as the "official" average rate hike, it's important to make sure we understand what accounts for the difference, so let's take a look at the ASPE report. The key area starts at the bottom of Page 4:
Benchmark Premium Increases
In the second year of the Marketplace, average premiums for the second-lowest cost silver plan increased only 2 percent, and in the third year they increased 7 percent. This year, Marketplace premiums are increasing more than they have the past two years. Through 2016, Marketplace rates remained below initial projections from the independent Congressional Budget Office, and below the cost of comparable coverage in the employer market. This year, with two years of cost data available, issuers are adjusting their premiums to bring them in line with costs. In addition, some of the ACA’s programs designed to support the new market in its early years are ending this year, putting transitory upward pressure on premium growth.
Under the ACA, people can no longer be denied coverage because they have a pre-existing condition, a crucial reform for up to 129 million Americans with conditions like asthma, diabetes, or heart disease. But because excluding people with pre-existing conditions was previously allowed in the individual market, there were no data available on how much it would cost to extend coverage to everyone, and many issuers’ initial premiums were below actual costs.
Notably, Marketplace rates through 2016 remained 12 to 20 percent below initial projections from the independent Congressional Budget Office.6,7 In addition, Urban Institute researchers recently found that 2016 Marketplace premiums were well below premiums for comparable employer coverage.8 Even with this year’s increases, Marketplace premiums in 2017 will still be roughly in line with the projections by the Congressional Budget Office. (See Appendix C for a detailed discussion.)
Table 6, in Appendix A, shows the estimated increase in the average second-lowest cost silver plan by state. (The second-lowest cost silver plan is significant because it provides the benchmark by which tax credits are calculated.) Across states using the HealthCare.gov platform, the median increase in the second-lowest cost silver plan premium is 16 percent, while the average increase is 25 percent.9,10 See Table 2 (See Table 13 in Appendix A for information by select cities and counties).
The gap between the average and the median rate increase in HealthCare.gov states reflects that most consumers are experiencing below average increases. Moderate rate increases or rate decreases in states like Arkansas, Indiana, Nevada, New Hampshire, New Jersey, North Dakota, Michigan, and Ohio suggest that Marketplaces in states around the country are maturing and approaching stable price points. Meanwhile, several of the states experiencing larger increases had 2016 premiums that were well below the national average and especially far below the cost of comparable employer plans in that state (for example, Arizona, Hawaii, Illinois, Kansas, and Pennsylvania).11
While complete data on Marketplace premiums in the 12 states not using the HealthCare.gov platform are not available, data on benchmark premiums are available for four states (California, Connecticut, Massachusetts, and Minnesota) and the District of Columbia, constituting about 60 percent of State-Based Marketplace enrollment. If these states are included, we estimate that the increase in the average second-lowest cost silver plan would be 22 percent. In particular, benchmark premiums in California, which accounts for about half of State-Based Marketplace enrollment, are increasing by an average of 7 percent.
In case you didn't get all of that, they also include a table which summarizes the numbers:
TABLE 2. Change in Benchmark Premiums from 2016 to 2017, HealthCare.gov States and Select State-Based Marketplaces for Which Data are Available Before Shopping and Tax Credits
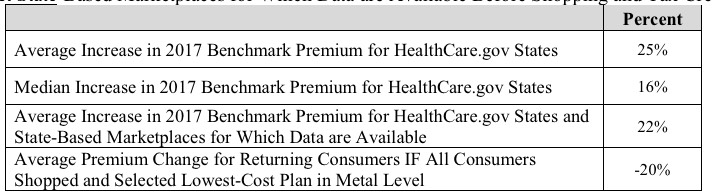
The first number appears to be the same as mine: 25%...but that clearly only refers to HealthCare.Gov states...when you include the dozen or so state-based exchange states (including large states like California and New York), the average drops to 22%. The more important word here is Benchmark.
The ASPE report only focuses on the benchmark plans available in each state. No, they're not trying to "hide" or "mask" anything here; the benchmark average is important to know, because that's what the entire Advanced Premium Tax Credit formula is based on. When the benchmark premiums increase, so do the tax credits:
Premium tax credits protect consumers from rate increases. Marketplace tax credits adjust to match changes in each consumer’s benchmark silver plan premium. A 27-yearold with an income of $25,000 a year will on average get a monthly tax credit of $160, a 62 percent increase compared to their tax credit in 2016. As a result, this consumer will pay $142 per month to purchase the benchmark plan in 2017, almost exactly the same as in 2016, when the consumer would have paid $143.
Remember, the benchmark plan is the second-lowest-priced Silver plan available in the enrollee's area.
Unfortunately, I don't see a table in the report which lists how many exchange enrollees are already enrolled in benchmark plans nationally, but they do specify that in California, it's about half of them (roughly 650,000 people).
So to summarize, the difference between the ASPE's 22% and my 25% are as follows (counting DC as a "state"):
- ASPE includes 44 states (representing appx. 93% of exchange enrollees); I include either 46 (approved rates) or 51 (requested rates)
- ASPE is only measuring the benchmark plan (2nd lowest-priced Silver); I try to include every ACA-compliant plan (Bronze, Silver, Gold, Platinum, Catastrophic)
- ASPE only looked at the ACA exchange-based enrollees, not those enrolled directly via off-exchange policies; I try to include the off-exchange market as well.
HHS reported appx. 10.5 million people still enrolled in effectuated ACA exchange plans as of 6/30/16. 93% of that is roughly 9.8 million people. Assuming that roughly half of those folks are enrolled in benchmark plans, that means that ASPE's 22% average applies to roughly 4.9 million people nationally. My own estimate of appx. 25% applies to the entire ACA-compliant on+off market (roughly 18 million people, give or take). Neither ASPE nor my own estimates, however, apply to the ~2.5 million people whose policies (either on or off-exchange) who will have to shop around for new plans this fall since their current policies are being discontinued.
Anyway, I just thought it was important to distinguish between what each number is actually measuring. The fact that ASPE's 22% is so close to my own 25% is actually pretty reassuring (although I would have been more than happy to have egg on my face if it turned out that the actual average was far lower than my estimate, of course).
Advertisement
