On the one hand, I'm a bit pouty today because I was off by about 6% on my HC.gov estimate through the 4th week. On the other hand, this is good news because it means that the actual enrollment total is 126K higher than I thought...and that's just via Healthcare.Gov! Of course, it's possible that the state exchanges will be a bit lower than I thought which might cancel this out, but assuming the 75/25 ratio is accurate, it should mean that instead of the 3.1 million national total I had estimated for 12/12, it should be closer to 3.3 million!
Anyway, here's the hard numbers from HC.gov through December 12th:
The CMS Dept. is holding a conference call with reporters right now. I'll be liveblogging the call and posting updates as quickly as I can for any useful info. It should focus much on the enrollment numbers, of course, but also how well the HC.gov servers held up under yesterday's strain, and I'd expect a lot of discussion of the "autorenewal" issue--how many, how it'll be handled and so forth.
Participants: Lori Lodes, Kevin Counihan & Andy Slavitt
3:04pm: Call hasn't started yet, but HHS just releaced their 4th week enrollment data for HC.gov (thru 12/12)...and it's actually 5.4% higher than I thought! (thanks to Bob Herman for the tip!)
My estimate: 2.32 million
Actual: 2,446,562
still 52% renewals / 48% new
Call starting:
first 8 hours: 20K applications
last 3 days: more than 3 million unique site visitors
HUGE news day, of course. In addition to HC.gov overperforming my estimate by 6% (2.46M as of 12/12 instead of 2.32M), Maryland and Massachusetts are out with their latest numbers.
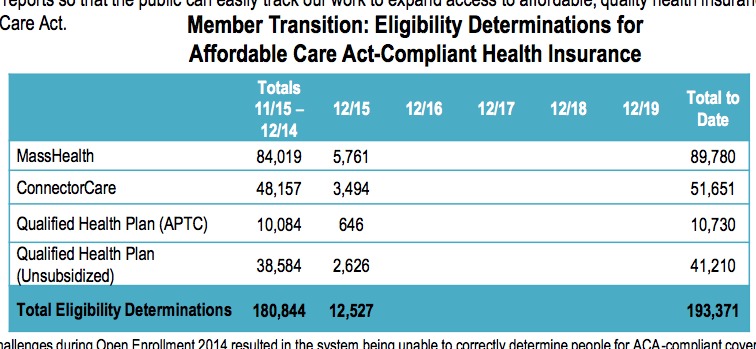
MA still isn't including an actual QHP selection update, but it should be roughly 56,600 based on the "QHP eligibility determinations" total of 103,591.
In addition, they're about to break 90K even added to Medicaid:
Hmmm...this is different; I'm pretty sure this is the first time that I've been quoted in a formal enrollment data press release...
MARYLAND HEALTH BENEFIT EXCHANGE BOARD CELEBRATES PROGRESS OF OPEN ENROLLMENT
Exchange enrolls more than 100,000 at one month mark
BALTIMORE (Dec. 16, 2014) — The Board of Directors of the Maryland Health Benefit Exchange (MHBE) today celebrated the progress of the Maryland Health Connection one month into its open enrollment. More than 100,000 Marylanders have signed up for 2015 health coverage.
Maryland Health Connection has enrolled 105,902 people — including 61,031 in Qualified Health Plans (QHPs) and 41,871 in Medicaid. By comparison, during the first open enrollment a year ago, 1,278 Marylanders enrolled in private QHPs through the marketplace during its first 30 days.
A rebuilt website that enables consumers to “browse” plans without needing to create personal accounts, a much larger schedule of enrollment fairs across the state than a year ago and additional “storefront” spaces where Marylanders can get assistance enrolling in person have helped propel the improved results. The changes have been noted in the media, including:
Beneficiaries with Healthy Michigan Plan Coverage: 487,190
(Includes beneficiaries enrolled in health plans and beneficiaries not required to enroll in a health plan.)
*Statistics as of December 15, 2014
*Updated every Monday at 3 p.m.
In all seriousness, obviously that 477K eligibility figure could be off; I've heard other estimates as high as 500,000, for instance.
The point is that the Medicaid expansion well in Michigan, along with many other states, is already running dry less than a year into the program (and in Michigan's case, less than 9 months into the program).
As you can see on The Graph, I'm also assuming roughly an 88% payment rate (ie, how many of those 12.5M I expect to pay for their first month's premium), which should be roughly 11.0 million even.
However, there's one number missing, which I left off in the interest of avoiding confusion: How many I expect to still be enrolled by the end of 2015. This is pretty simple, though: Around 10.5 million. How do I arrive at that number? Well, this year the net attrition rate resulted in around 6.7 million people still being enrolled nationally as of mid-October. That's around 84% of the 8.0 million "total" enrollment figure as of last April. In other words, out of 8 million people, about 12% never paid and another 4% gradually dropped off the exchanges by October.
Assuming a similar pattern next year, 84% of 12.5 million is 10.5 million who should still be enrolled via ACA exchanges as of next October.
I've received some interesting information regarding just how CMS/HHS plans on handling autorenewals (aka "passive re-enrollments") for those people who are currently enrolled in ACA exchange QHPs, but who took no action whatsoever as of midnight last night. It's important to note that this information only relates to those enrolled in 35 of the states run through HC.gov (that is, this doesn't relateto any of the state-run exchanges, and it doesn't even include Oregon or Nevada, since everyone currently enrolled in those states has to manually re-enroll).
So, we're talking about a maximum number of perhaps 5 million people here...and even then, a good half of them have likely manually re-enrolled, leaving perhaps another 2.5 million.
Having said all that, here's the info: In most cases, anyone who neither manually re-enrolled nor manually cancelled their policy should be automatically re-enrolled in their current policy (albeit possibly at a higher--or, in a few cases, lower--premium cost).
As you can see from the graphic I posted yesterday (and had to revise several times throughout the day), the official enrollment deadline for private policies starting on January 1st, 2015 has now passed for all 37 states operating via HealthCare.Gov, as well as residents of DC, Hawaii and Kentucky. It's certainly possible that any or all of these will announce some sort of "special circumstances" allowance for those who didn't make the midnight cut-off (10pm in Alaska), but I'm assuming those would be done strictly on a case-by-case basis.
OK, so what about the remaining 11 states?
Well, 4 of them (MD, MA, RI & WA) had later deadlines for January coverage all along: Maryland on 12/18 (Thursday) and the other 3 on 12/23 (next Tuesday).
New York and Idaho bumped their deadlines out from yesterday until 12/20 (Saturday), although Idaho had previously claimed that their deadline was 12/23, but are now claiming that it was originally 12/15. I still don't understand what happened there, but so be it: 12/20 it is for ID.
It's been a crazy day, and there have been some major developments: California, Connecticut, Minnesota and Vermont all announced last-minute deadline extensions of various types for January 1st coverage. In addition, I received an unexpected bounty of enrollment data drops (either partial or complete) from California, Connecticut, DC, Hawaii and Massachusetts. On top of all that, there was big Medicaid news out of Pennsylvania and Tennessee.
So, after this massive information overload, have I changed my projections at all? Well, I may still adjust my calls for future milestones, but I'm sticking to my guns for Week 4 (December 12th) and Deadline Day (December 15th):
I'm actually a bit curious about the "new" specification here. Last week the head of the HI exchange gave an interview in which he gave the number as being 12,000, but it turned out that was a cumulative number which included all of the enrollments from last year (whether they had renewed yet or not) as well as the new additions. I thumbnailed it as being around 1,200 enrollments for 2015.
Therefore, I'm not sure how to take "nearly 1,500 new residents" in this case; that may mean "new for 2015 including renewals" or it may mean "new for 2015 not including renewals". Either way, the number isn't large enough to impact my spreadsheet/projections, but it's still a bit irritating:
Hawaii: Hawaii Health Connector has enrolled nearly 1,500 new residents as of Dec. 5. Last year glitches to the website caused enrollment to be delayed by two weeks. According to HealthInsurance.org, the state’s uninsured population has gone down from 8 percent of the population to 6 percent of the population since Obamacare went into effect..