

In which I finally put that absurd 2013 WSJ graphic to good use
Sun, 10/05/2025 - 10:07am
Twelve years ago, the Wall St. Journal ran a story about the impact of the American Taxpayer Relief Act of 2012, a sweeping tax bill signed into law by President Obama which locked in the Bush tax cuts for lower & middle-class households while allowing them to expire on schedule for wealthier Americans:
A compromise measure, the Act gives permanence to the lower rate of much of the Bush tax cuts, while retaining the higher tax rate at upper income levels that became effective on January 1 due to the expiration of the Bush tax cuts. It also establishes caps on tax deductions and credits for those at upper income levels. It does not tackle federal spending levels to a great extent, rather leaving that for further negotiations and legislation. The American Taxpayer Relief Act passed by a wide majority in the Senate, with both Democrats and Republicans supporting it, while most of the House Republicans opposed it.
The WSJ story, titled "How Much Will Your Taxes Jump?," led to widespread derision at the time for wringing its hands over wealthy people having to go back to (gasp) paying a few percent more of their sky-high incomes in taxes. In particular, there was an accompanying graphic showing four supposedly "typical" scenarios which led to much public mockery (including by myself):
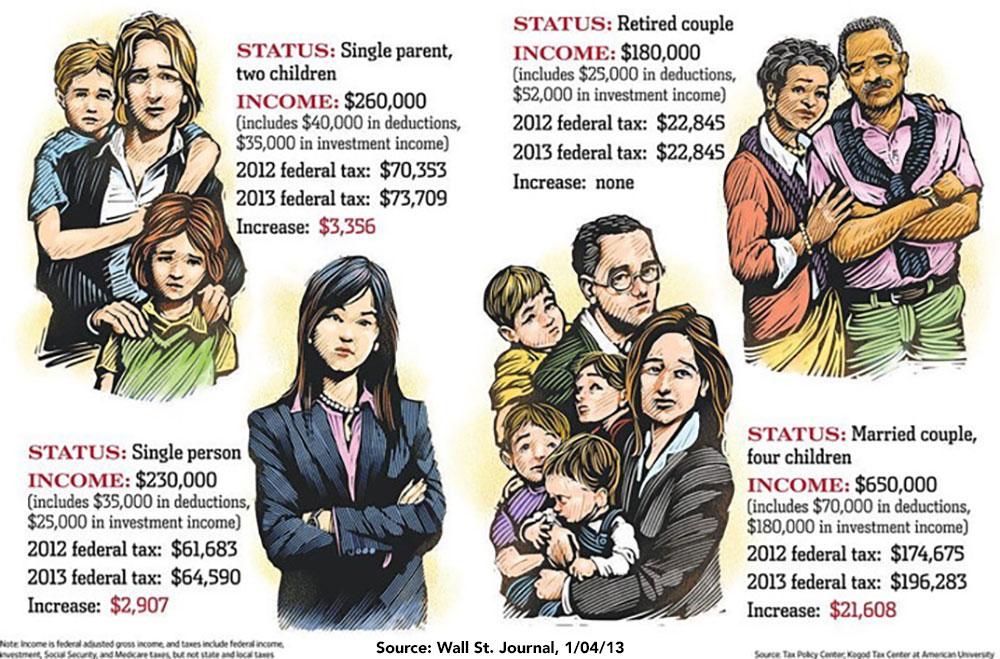
Oh no! A young single adult with no kids earning nearly a quarter million dollars a year might have to pay 1.2% more in taxes! A family earning $650,000 might have to pay 3.3% more! Oh the humanity!
Even worse: Adjusted for inflation, the single parent would be earning $365,000 today; the young adult would earn $323,000; the retired couple $253,000; and the couple with kids would earn a whopping $914,000 in 2025 dollars.
Notice how they’re MISERABLE as they stare wanly out at the reader, pleading for help. Yes, the single mother earning $260,000/year is obviously the direct descendant of the famous "Dust Bowl/Grapes of Wrath" mother from the famous Dorothea Lange photo.

The problem wasn't really with the artwork itself, however: It was placing those pained looks on the faces of people earning three to five times the median 2025 household income.
Anyway, over a decade later, I think I've finally found a way to put the artwork itself to good use with actual examples of financial hardship hitting everyday Americans.
As regular readers know, for months now I've poured a ton of time and effort into creating estimates of how much ACA exchange health insurance premiums are likely to increase starting January 1st due to the combination of the enhanced premium tax credits expiring as well as the Trump Regime's so-called "Integrity and Affordability Rule" being implemented.
While the 2026 ACA Open Enrollmennt Period doesn't start until November 1st, there are a handful of states operating their own ACA exchange website platforms which have already launched "Window Shopping" so that prospective enrollees can plug in their household information and see their actual 2026 rate hikes instead of my estimates, which of course include a bunch of caveats.
Out of 20 states that operate their own ACA exchanges (Illinois is scheduled to become the 21st next month), as of this writing there are five which have already launched 2026 Window Shopping:
- Georgia (Georgia Access)
- Idaho (Your Health Idaho)
- Nevada (Nevada Health Link)
- New York (NY State of Health)
- Virginia (VA Insurance Marketplace)
With that in mind, here's four examples of how much actual typical Americans will see their 2026 premiums increase starting January 1st. There's still a few caveats to keep in mind, however:
- All examples assume that their household makeup and income remain the same next year.
- All examples assume that the household is currently enrolled in the benchmark Silver plan for their area.
- All examples assume that they'd prefer to stay with the same carrier (for provider network purposes) and that they'd prefer to stay on a Silver plan if feasible.
This last point is key, because the benchmark Silver plan often changes from one year to the next, and frequently changes to a different carrier. For my purposes, for 2026 I've chosen the least-expensive Silver plan available from the same carrier they're enrolled in today.
With that in mind, here we go:
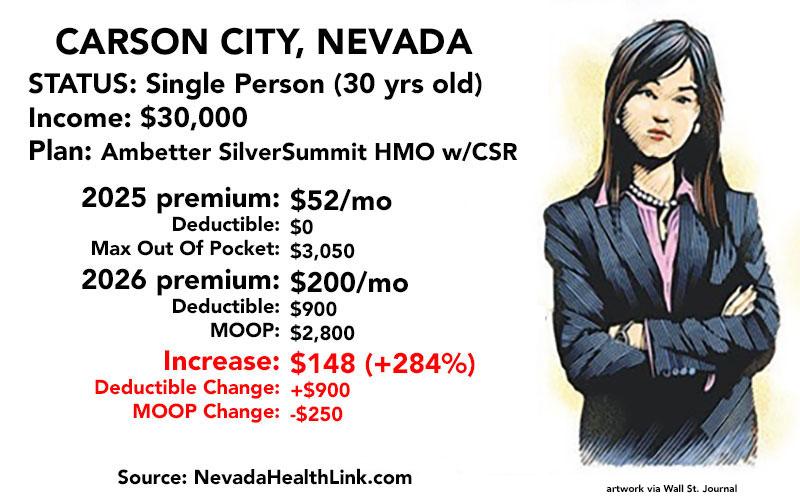
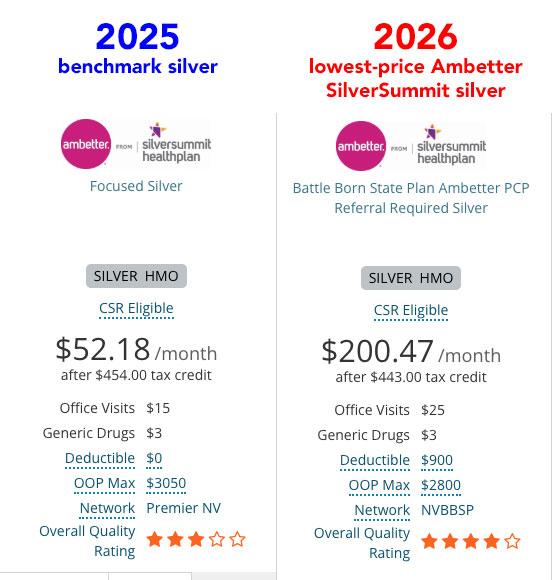
In the appropriately-nicknamed Silver State of NEVADA, I'm going to use a 30-yr old single woman earning $30,000/year in Carson City. The benchmark Silver plan there is an Ambetter via SilverSummit HMO plan for just $52/month. Her annual income is just under the cut-off for her to qualify for generous Cost Sharing Reduction (CSR) assistance to cut down on deductibles & co-pays both years.
In 2026, the benchmark plan changes from Ambetter to a Renown from Hometown Health, but the lowest-priced Ambetter Silver HMO is gonna run $200/month.
That's nearly 4 times as much...and worse, her deductible goes from nothing to $900, although her maximum out of pocket cap actually drops slightly.
What about shopping around for a lower-cost plan?
Well, if she wants to stick with Ambetter, the least-expensive Bronze plan would still cost $122/month (2.3x more than she's paying now)...and she would lose out on her Cost Sharing Reduction assistance (which is only available with Silver plans) and be hit with an $8,450 deductible & $10,150 MOOP.
In order to keep the CSR assistance, she'd have to stick with a Silver plan. The least-expensive Silver plan available in Carson City next year would be from Renown/Hometown Health...which would still cost $150/month.
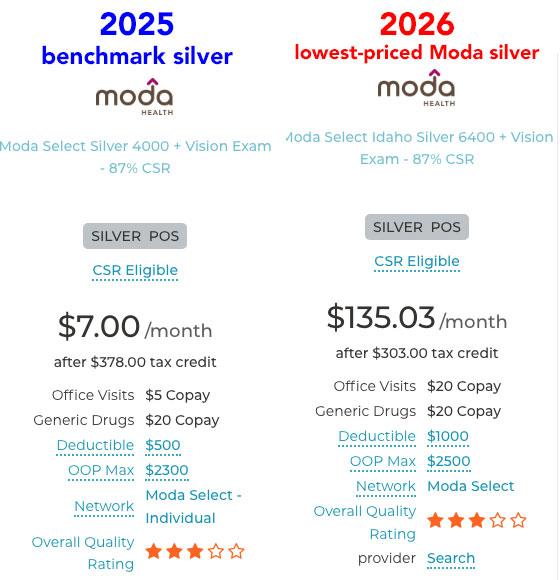
Next up is the single mother with two young children. In her case I'm assuming she lives in Boise, IDAHO and earns $40,000/year.
In Boise, both the benchmark Silver plan this year as well as the lowest-cost Silver plan next year are from Moda Health. Again, she only earns a bit over 150% FPL both years so she also qualifies for generous CSR assistance. In fact, her kids are eligible for the Children's Health Insurance Program (CHIP).
IMPORTANT: The window shopping tool at Your Health Idaho lets you know that children may be eligible for CHIP if your income is low enough, but it still assumes that they'll be enrolling in the exchange plan by default. You have to manually uncheck the "Seeking Coverage" boxes for any children under 19 if you want the plan selection tool to calculate your net premiums properly. This is a software flaw which I'm stunned hasn't been fixed in the decade-plus that the Idaho ACA exchange website has been operating.
She's paying just $7/month this year...but starting in January, this will skyrocket by over 1800% to $135/month. Also, even with CSR help, her deductible will double to $1,000 while her maximum out of pocket cap will go up by $200.

How about shopping around?
The good news is that in Boise, Idaho, Moda Health has 3 different Bronze plans which would cost her less than $25/month. The bad news is that, again, downgrading from Silver to Bronze means losing CSR assistance; her deductible would skyrocket to anywhere from $7,500 to $10,000.
Next: VIRGINIA. The artwork shows a couple with four kids, which is two more than I usually use in these examples.
I'm placing them in Richmond City and assuming the parents earn a combined $110,000/year (a little over 250% FPL both years). This means that they aren't eligible for any CSR assistance either year, nor are their children eligible for CHIP in Virginia at that income.
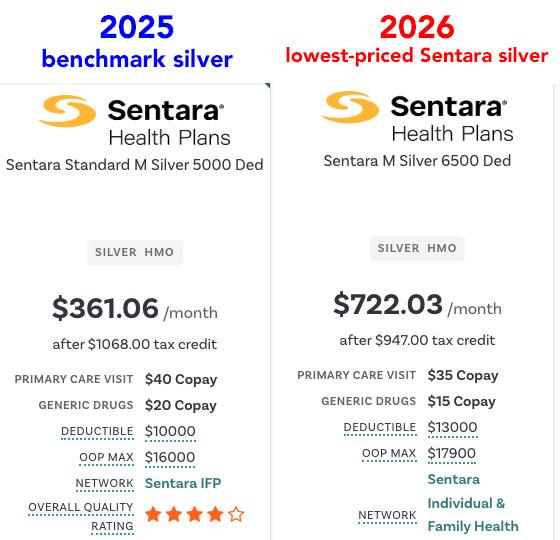
Anyway, the benchmark plan in 2025 is a Sentara Standard Silver plan, for which they're paying $361/month. Next year, however, the lowest-priced Sentara Silver plan will cost them $722/month... exactly twice as much.
There's some salt in the wound as well: Their deductible will increase by $3,000 and their maximum out of pocket ceiling by $1,900.
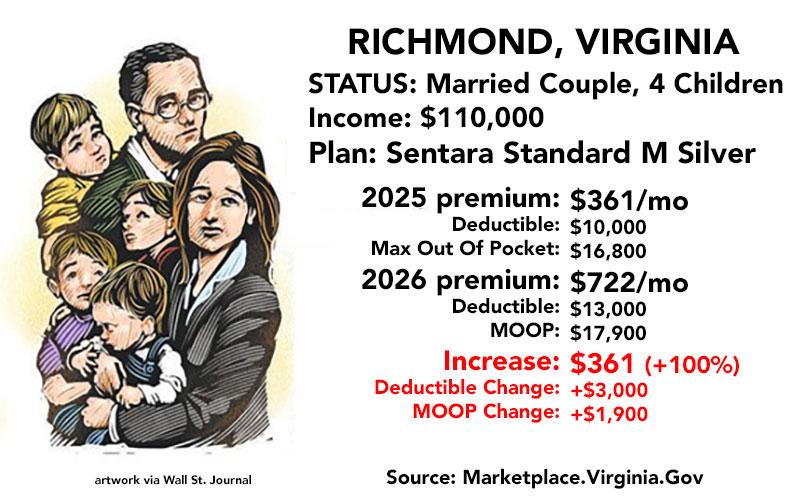
What about shopping around?
In this family's case, the lowest-priced Silver plan is from Sentara...and they aren't eligible for CSR help anyway. However, they do have one better alternative which is also from Sentara: A GOLD plan which actually costs less than the Silver plan would...and which has a lower deductible and MOOP as well!
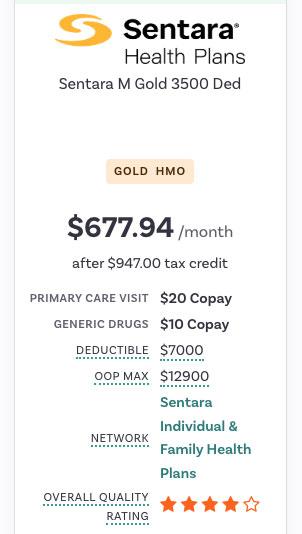
This may seem counterintuitive, but thanks to Silver Loading, Gold plans in many states may cost less than a Silver plan even though the Gold plan has lower out of pocket costs as well!
Granted, this family would still be paying 88% more in premiums, but that's still better than a 100% spike...and they'd save up to $3,000 in out of pocket expenses, at least.
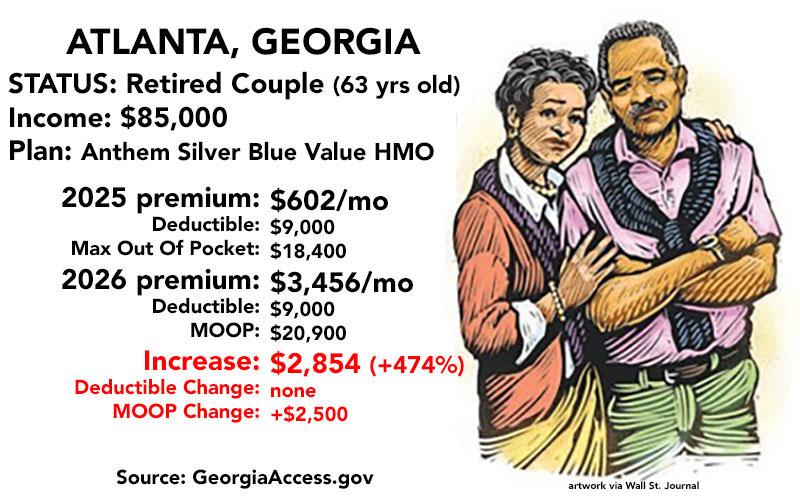
Now we come to a retired couple living in Atlanta, GEORGIA.
I made them 63 years old this year so that they'll still need to use an exchange plan next year as well (once they turn 65, of course, they'll become eligible for Medicare instead).
$85,000 a year for two people is 416% FPL in 2025 and 402% in 2026...just barely over the dreaded "Subsidy Cliff" threshold which, as you're about to see, is about to come roaring back with a vengeance.
This year they're paying just $602/month (8.5% of their gross income) for the benchmark Anthem Silver Blue Value HMO...but if the tax credit formula reverts back to the pre-2021 level, they'll have to start paying full price in January...and the lowest-priced Silver plan available from Anthem next year is clocking in at a whopping $3,456/month at full price.
That's a stunning 5.7 times as much as they're paying today, and would amount to nearly half of their gross income.
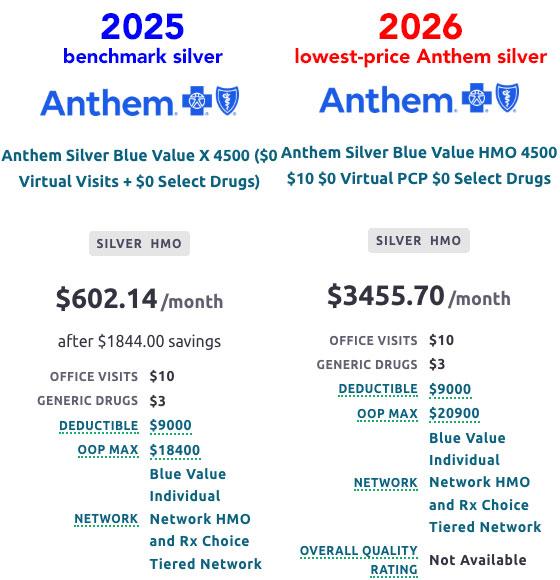
What about shopping around?
Obviously they'd be insane to stick with this, so to tide them over until they qualify for Medicare they'll likely shop around for a lower-cost plan.
Unfortunately, in this case, the least-expensive plan (a Bronze HMO which more than doubles the deductible from $9,000 to $21,200) would still cost $2,386/month...or over 1/3 of their income in premiums alone.
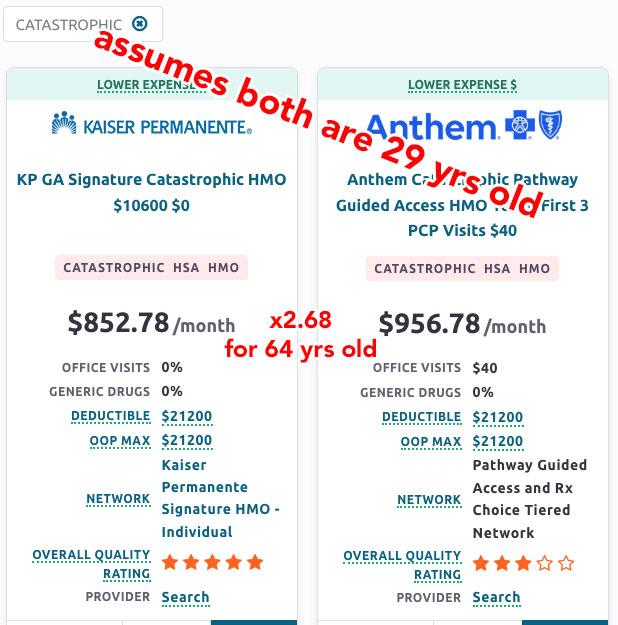
How about the Trump Regime's new opening of the floodgates on Catastrophic plan eligibility?
Well, the exchanges are currently programmed not to even let you see Catastrophic plans unless you're under 30 years old, so I started by changing their ages to 29. IF they were that young, they could get a catastrophic plan from either Kaiser Permanante for $853/month or stick with Anthem BCBS for $957/month...either of which would still cost 42% - 59% more than they're paying now.
HOWEVER, they're not 29 years old. They'll both be 64 next year, and assuming the Age Band multiplier for Catastrophic plans is the same as it is for other individual market plans in Georgia, you'd have to multiply those prices by 2.68, which would put the cost of a Catastrophic plan for this couple at $2,286 or $2,565/month...basically the same as a Bronze plan anyway.
The WSJ graphic only included four household examples, and this entry is getting pretty long already, so I'm gonna skip New York...but I think you get the idea.
Again, in all of these cases the enrollees will likely shop around for a better value, but in most cases they'll just be trading off lower premiums (which will still usually be higher than they're paying now) for higher deductibles, co-pays and coinsurance...and in at least one case (the older couple in Atlanta), they're pretty much priced completely out of the individual market altogether...right when they're at an age where they absolutely can't afford NOT to have comprehensive health insurance.
Advertisement
