Yes, Republicans have been dying of COVID at much higher rates than Democrats. NO, it's not even close to 5 times higher.

As I noted earlier this week, there's been a lot of renewed buzz recently about an article at Vice Media regarding the partisan divide in COVID death rates over the past couple of years.
I admit to not really understanding why the Vice story is making the rounds this week in particular. The article is from mid-November, and the study by researchers at the National Bureau of Economic Research which it references was first published in early October...in fact I wrote about it at the time.
The other thing which caught my eye recently is this viral tweet:
Every 10 days, more that 8,000 unvaccinated Republican voters are dying of COVID-19, five times the rate for Democrats, who have had at least 2 vaccination shots.
— An Academic View (@academicviews) January 12, 2023
I immediately noticed several major red flags:
- First, 8,000 GOP voters every 10 days would be 800 per day, which makes no sense since total U.S. COVID deaths haven't hit 800/day since March 2022
- Second, the "5x the rate of Dems" part would mean an additional 160 Democratic voters per day
- Third, since only ~70% of U.S. adults at most vote in Presidential elections (and far fewer in midterms), this means perhaps ~30% of U.S. COVID deaths are among non-voters. That would mean the grand total of U.S. COVID deaths would have to average around ~1,400 per day or so, which, again, hasn't happened since early March of 2022.
- Fourth, and perhaps most importantly: Even if you go back to the points of the pandemic when total U.S. deaths were that high, the "5x more GOP voters than Dem voters" part is still ludicrously overstated.
I'll come back to the viral tweet itself in a little bit, but first, let's take a look at the NBER study which is getting so much attention again this week and compare it to my own, cruder estimates from a month earlier, which came to similar conclusions despite using different methodology and covering a different time range:
- NBER's study ranged from March 2020 - December 2021, with a break point of April 2021 (when vaccines were made widely available to all U.S. adults).
- My estimate covered the period from November 2020 - September 2022 (basically starting at the 2020 Presidential election and ending just before the 2022 Midterms), and my monthly updates about the topic have mostly run from May 2021 until the present (my previous analysis covers May 2021 - January 2023).
Below I've re-run my own estimates in an attempt to match up the starting & ending dates as closely as possible to the NBER study, using the same methodology I used in September, with one modification. As a reminder, here's my data sources:
As I noted at the time, I'm aware that exit polling has some significant flaws, but it's the best I have to go with.
The modification I made has to do with trying to account for the misreported/mis-categorized death factor due to families, coroners & medical examiners either unintentionally or deliberately not listing COVID-19 as a contributor to or outright cause of death on death certificates, which became a major problem as the pandemic gradually became politicized. As I noted last May, supposedly "non-COVID" excess death rates ran a stunning twenty-one times higher in the reddest tenth of the country than the bluest tenth in 2021.
In my Nov. 2020 - Sep. 2022 analysis, I tried to account for this by applying a 20% "Trump modifier" across the board. However, the "excess death" factor didn't really show up until 2021. In 2020, there were around 109K deaths nationally which were likely due to COVID but not categorized as such...making the total COVID death toll a whopping 31% higher than the official tally nationally. However, these only ran around 45% higher in the reddest decile vs. the bluest decile.
Given that it took several months for many doctors, coroners, medical examiners etc. to understand what to look for in the early days of the pandemic, the odds are high that many of these misdiagnoses were unintentional...which would explain why there wasn't much of a partisan divide.
In 2021, however, it was a different story. Democrats took over both the White House and the Senate, and the COVID vaccines, which had ironically been developed under a Republican administration, were nonetheless distributed under a new Democratic administration. The vaccines started becoming widely available in the spring and by the beginning of May were available to every U.S. adult in the country.
For calendar year 2021, there were fewer "likely COVID" excess deaths total (around 62,000 vs. 109,000 in 2020), making the total likely COVID death toll just 15% higher than the official total...but the partisan distribution was much greater: They were 21x higher in the reddest decile than the bluest.
In light of this, since my revised analysis is split into multiple portions anyway (pre-vaxx and post-vaxx thru the end of 2021), I've applied the following:
- 2020: No red modifier
- 2021 Q1: 5% modifier
- 2021 Q2 - Q4: 25% modifier
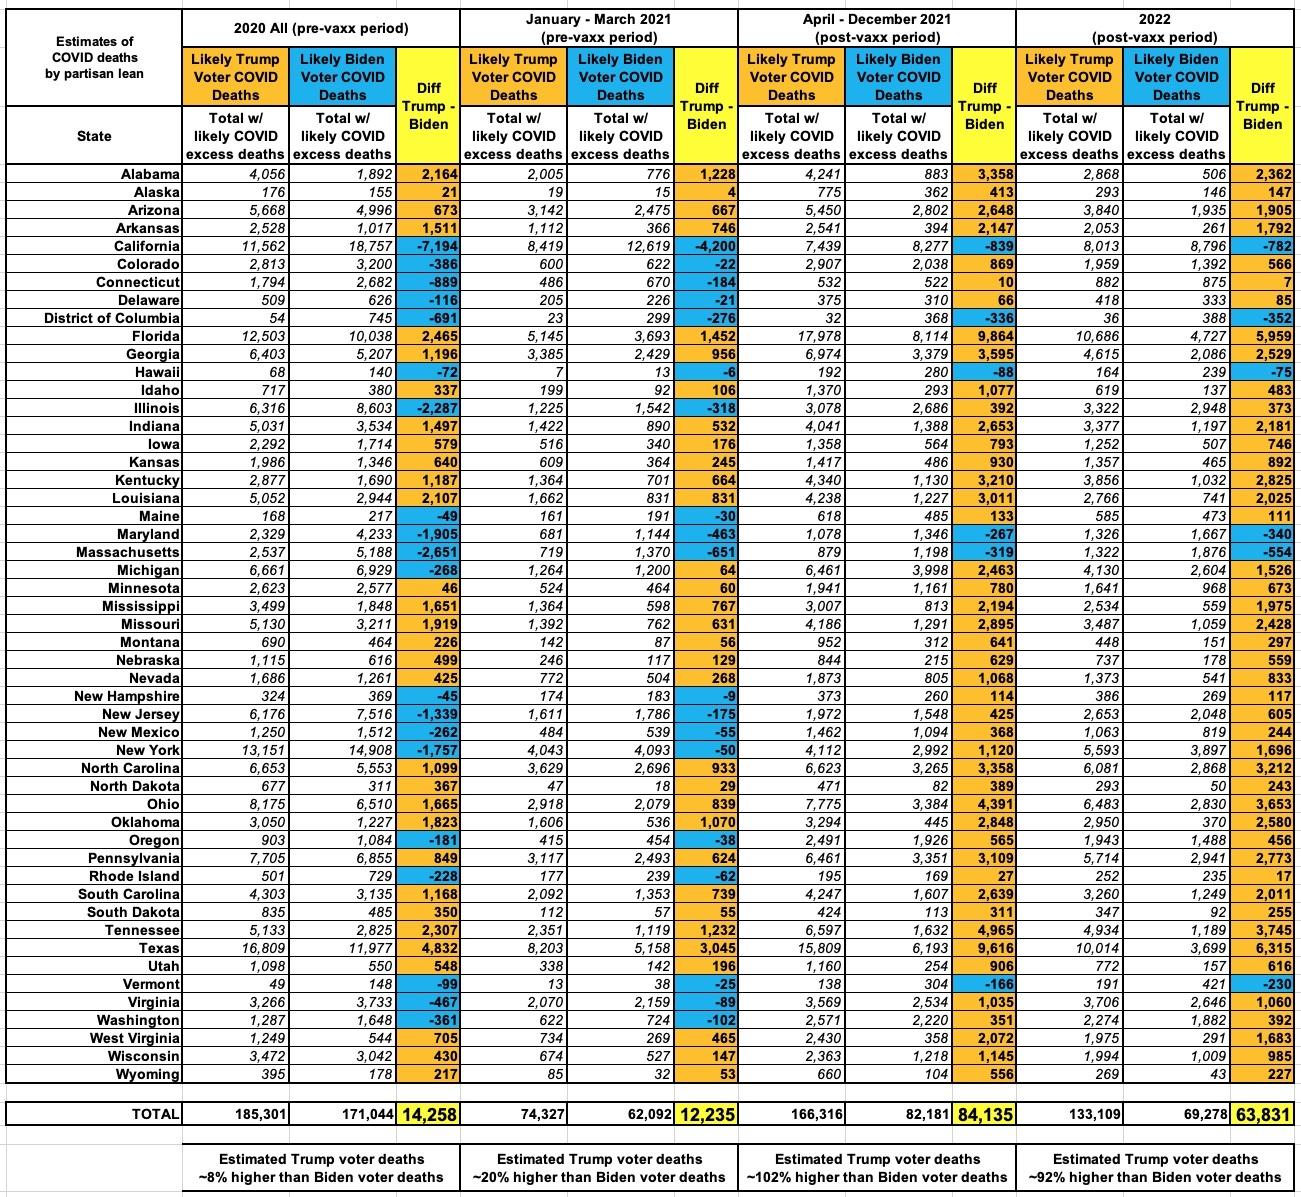
Doing so gives the following estimates (I also ran the estimate for the full calendar year 2022 as well for completeness' sake, assuming actual COVID deaths were still running ~15% higher than the official numbers and with a similar 25% modifier:
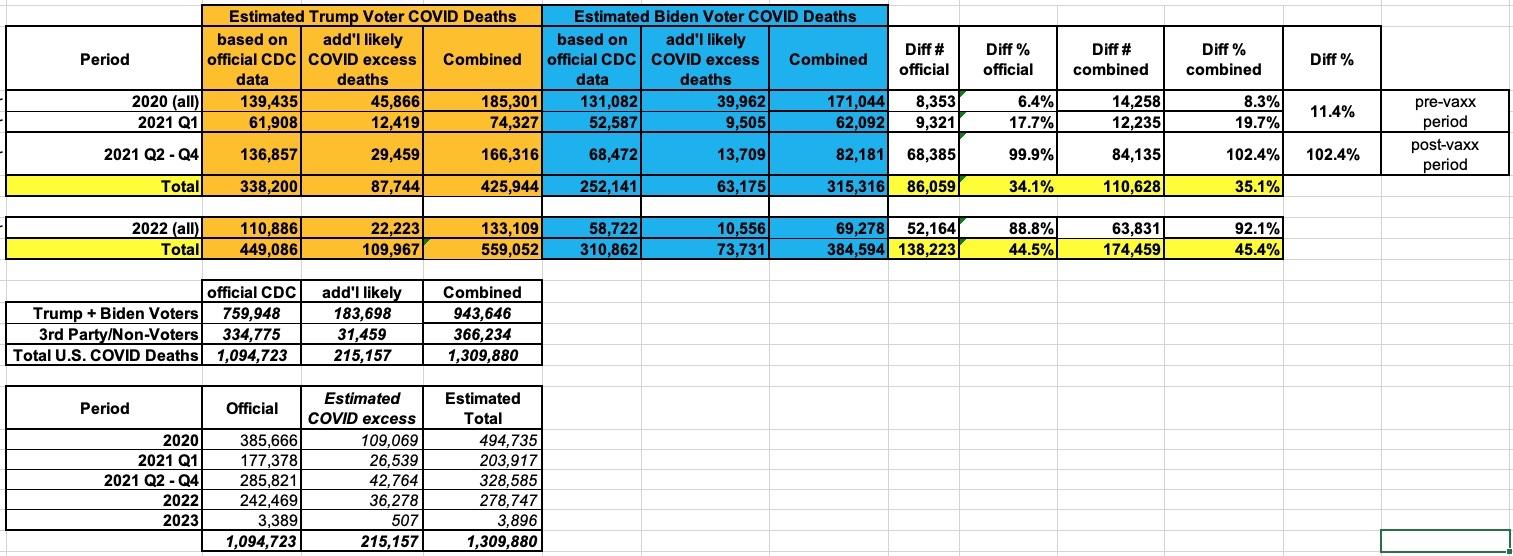
Here's what the summary looks like for each time period:
The NBER study concluded that:
Overall, the excess death rate for Republicans was 5.4 percentage points (pp), or 76%, higher than the excess death rate for Democrats. Post- vaccines, the excess death rate gap between Republicans and Democrats widened from 1.6 pp (22% of the Democrat excess death rate) to 10.4 pp (153% of the Democrat excess death rate). The gap in excess death rates between Republicans and Democrats is concentrated in counties with low vaccination rates and only materializes after vaccines became widely available.
I've confirmed that the "22% of Democrat excess death rate" actually means 22% higher than the Democrat excess death rate prior to widespread vaccine availability, which widened further to 153% higher than the Democrat excess death rate in the last 9 months of 2021. It's important to note that the NBER study looks at excess death rates during the COVID pandemic, which, again, isn't quite the same as COVID-specific death rates.
By contrast, my own estimates (using admittedly cruder methodology) are that the GOP voter deaths ran around 11% higher for the pre-COVID period and around 102% higher in the post-COVID period, for a combined average GOP voter death toll just 35% higher...far less than NBER's 76% estimate.
In other words, my estimates appear to be more conservative than the NBER study found.
(I listed 2022 separately since it wasn't included in the NBER study at all, but if it's included in the mix, the red/blue divide increases to 45.4% overall)
Now, obviously there's any number of variables which I haven't taken into account...but it includes all 50 states + DC. The NBER study, by contrast, uses far superior methodology...but it also only applied to two states (Florida and Ohio).
The larger point is that neither analysis has the Republican vs. Democratic voter COVID death gap being anywhere close to five times higher. The highest it reaches in my analysis is around 2:1 (102% higher); the highest the NBER study finds is around 2.5:1 (153% higher).
So, getting back to that viral tweet which claimed the "8,000/10 days, 5x higher" rate, where exactly did that come from? The tweet wasn't part of a thread, so there's no source listed or link to any such finding. The person who tweeted it supposedly has a Ph.D from the University of California, but doesn't include his real name or profession beyond being a "writer, philosopher and journalist" in his bio. On the other hand, it's such a specific and confidently-worded claim, it seems like it had to come from somewhere.
So, I did a bit of basic Googling of the claim, and the original source seems to be someone I never would have expected. I was shocked and dismayed to discover that the 8,000/5x higher claim seems to have originated from...Neil DeGrasse Tyson. Via Snopes:
Astrophysicist, director of the Hayden Planetarium in New York, "Startalk" podcast host and occasional Twitter "intergalactic troll" Neil deGrasse Tyson on Aug. 31, 2021, penned a tweet he later deleted because he said it was "causing too many unintended Twitter fights."
The deleted tweet compared the rate of COVID-19 deaths among "(unvaccinated) Republican voters" to Democrats.
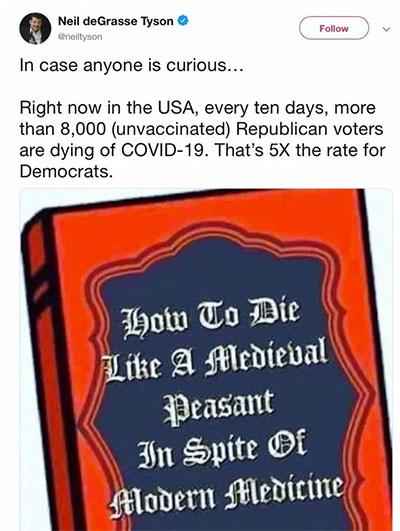
"Right now in the USA, every ten days, more than 8,000 (unvaccinated) Republican voters are dying of COVID-19. That’s 5X the rate for Democrats," the tweet read. The post also contained a drawing of a book titled, "How to Die Like a Medieval Peasant In Spite of Modern Medicine."
Here is an image of the now-deleted tweet, which was archived by the Internet Archive (the same post is still on Tyson's Facebook page):
Tyson either didn't provide a source for that information, or if he did, it was lost when he deleted the tweet. There was no source provided in the corresponding Facebook post.
While Tyson doesn't provide any source or context for his claim, one possible factor to consider is the timing of it...but even that doesn't hold water. He tweeted this out on August 31st, 2021. Assuming he was referring to death rates that month in particular, around 48,500 Americans died of COVID in August 2021 total according to CDC data. That breaks out to ~1,560 per day nationally, so the total death rate, at least, was in the range of Tyson's claim that month. So far, so good.
As for the ratio being 5 GOP voters to 1 Dem voter for August 2021 specifically, however, using the same methodology that I did above for that month alone (including the 25% modifier), this would still only give you roughly a 2.25:1 ratio. Assuming the NBER methodology is more accurate (which I'm sure it is), you might get as. high as 2.5 - 3.0x higher for the month of August alone, but that's still nowhere close to 5x higher.
In other words, it's conceivable that Tyson's claim might have been within 40% of the actual ratio for a brief period of time a year and a half ago...but even if that was the case then, it certainly isn't at the moment.
And yet over 650,000 people have read the "Academic View" tweet in the past week, nearly 18,000 have liked it and it's been retweeted over 4,000 times so far.
I've been one of the earliest and loudest voices calling attention to the massive partisan divide when it comes to COVID vaccinations and death rates over the past year and a half, so it behooves me to say this clearly: The gap is dramatic enough, and the point is clear enough, without people exaggerating it to absurd proportions.
How to support my healthcare wonkery:
1. Donate via ActBlue or PayPal
2. Subscribe via Substack.
3. Subscribe via Patreon.


