

EXCLUSIVE: "Non-COVID" excess death rates ran 21x higher in reddest counties than bluest in 2021
Fri, 05/06/2022 - 1:42pm
Joint post by Charles Gaba & Andrew Stokes
As noted a couple of weeks ago, I've decided to ease up on my obsessive COVID vaccination & death rate tracking. I'm not abandoning it entirely, mind you; I'm just dropping the updates from weekly to monthly.
There's two reasons for this: First, the weekly updates have been monopolizing my time & energy, making me fall behind on a whole mess of other important healthcare policy stuff; after all, this is ACASignups.net not COVIDTracker.net. Secondly, I think it's fair to say that after meticulously tracking the data for nearly two years (in the case of COVID deaths) or one year (in the case of vaccination rates), I've more than made my point.
However, there's one other important factor which I haven't delved into...because I never had access to the data, at least not at the county level: Excess deaths. For this, I've enlisted the assistance of Andrew Stokes, Asst. Professor at the Boston University School of Public Health, to the point that I'm giving him co-author credit for this entry.
As many others have noted, the actual COVID death toll, both here in the United States and around the world, is almost certainly considerably higher than the official numbers which have been reported.
Globally, the World Health Organization just released a new report stating that nearly 15 million more people have died since the COVID pandemic hit two years ago than normally would have...compared to the official COVID death toll of around six million.
In some cases, the cause of death wasn't COVID-19 itself, but something indirectly connected. For instance, if someone had a heart attack but couldn't get to the hospital on time because all of the ambulances were filled with COVID patients, and so forth.
In other cases, the cause of death was COVID-19 but was misdiagnosed as something else. Often this was an honest misdiagnosis, especially in the earliest days of the pandemic before accurate testing was available and some hospitals/labs even knew what to look for.
In many instances here in the U.S., however, the reason is far more concerning. As noted in this article in the Missouri Independent from December 2021:
Short-staffed, undertrained and overworked coroners and medical examiners took families at their word when they called to report the death of a relative at home. Coroners and medical examiners didn’t review medical histories or order tests to look for COVID-19.
They, and even some physicians, attributed deaths to inaccurate and nonspecific causes that are meaningless to pathologists. In some cases, stringent rules for attributing a death to COVID-19 created obstacles for relatives of the deceased and contradicted CDC guidance.
These trends are clear in small cities and rural areas with less access to healthcare and fewer physicians. They’re especially pronounced in rural areas of the South and Western United States, areas that heavily voted for former President Donald Trump in the 2020 presidential election.
You get the picture.
Until now, however, I didn't have comprehensive, reliable county-level data on excess deaths.
This is where Professor Stokes comes in. He and a team of nine colleagues at BU and other institutions recently published a new study at medRxiv, the Preprint Server for Health Sciences:
Excess all-cause mortality across counties in the United States, March 2020 to December 2021
- Eugenio Paglino, Dielle J. Lundberg, Ahyoung Cho, Joe A. Wasserman, Rafeya Raquib, Katherine Hempstead, Jacob Bor, Irma T. Elo, Samuel H. Preston, Andrew C. Stokes
Official Covid-19 death tallies have underestimated the mortality impact of the Covid-19 pandemic in the United States. Excess mortality, which compares observed deaths to deaths expected in the absence of the pandemic, is a useful measure for assessing the total effect of the pandemic on mortality levels. In the present study, we produce county-level estimates of excess mortality for 3,127 counties between March 2020 and December 2021. We fit two hierarchical linear models to county-level death rates from January 2015 to December 2019 and predict expected deaths for each month during the pandemic.
We compare these estimates with the observed numbers of deaths to obtain excess deaths for each county-month. An estimated 936,911 excess deaths occurred during 2020 and 2021, of which 171,168 were not assigned to Covid-19 on death certificates. Urban counties in the Far West, Great Lakes, Mideast, and New England experienced a substantial urban mortality disadvantage in 2020, whereas rural counties in these regions had higher mortality in 2021. In the Southeast, Southwest, Rocky Mountain, and Plains regions, there was a rural mortality disadvantage in 2020, which was exacerbated in 2021. The proportion of excess deaths assigned to Covid-19 was lower in 2020 (76.3%) than in 2021 (87.0%), suggesting fewer Covid-19 deaths went unassigned later in the pandemic. However, in rural areas and in the Southeast and Southwest a large share of excess deaths were still not assigned to Covid-19 during 2021.
Deaths during the Covid-19 pandemic have been primarily monitored through death certificates containing reference to Covid-19. This approach has missed more than 170,000 deaths related to the pandemic between 2020 and 2021. While the ascertainment of Covid-19 deaths improved during 2021, the full effects of the pandemic still remained obscured in some regions. County-level estimates of excess mortality are useful for studying geographic inequities in the mortality burden associated with the pandemic and identifying specific regions where the full mortality burden was significantly underreported (i.e. Southeast). They can also be used to inform resource allocation decisions at the federal and state levels and encourage uptake of preventive measures in communities with low vaccine uptake.
Stokes posted a long thread on Twitter which goes into their findings. I've compiled the bulk of it below into an easier-to-read format, which he's given me permission to repost:
In our new pre-print, we examine excess deaths in 3,127 counties between March 2020 and December 2021. Our findings: 936,911 excess deaths occurred 171,188 were not counted in official Covid-19 death tallies Why were they not counted?
Some deaths were likely deaths indirectly related to the pandemic (drug overdose, deaths related to food insecurity and economic insecurity, deaths related to interruptions in health care) and were not Covid-19 deaths. Many, however, were uncounted Covid-19 deaths.
How do we know this? Investigative reporting, including a USA Today report written in collaboration with our team, reveals that many death investigators are not accurately assigning Covid-19 deaths on death certificates.
Coroners are elected officials and have little to no medical training. They are on the record saying statements like... "We do what families tell us.” “We don’t do Covid deaths.” “We don’t have the infrastructure to go and check everybody for Covid-19.”
In Texas, local death certifiers reported that they didn’t want to waste money ordering tests on people who were already dead, nor were they counting the deaths as COVID-19 deaths based on information provided by family members.
Undercounts are a serious problem that can obscure the communities most affected by the pandemic, affecting resource allocation and policy-making. Undercounts may also distort individual risk perceptions, leading to lower vaccine uptake and less masking/social distancing.
Prior work from our team suggests that the undercounts are not happening evenly - they are occurring more frequently in areas with less health insurance and primary care and in counties with more home deaths.
For families who have lost loved ones to causes related to the pandemic, if that death is not assigned to Covid-19, they will miss out on important benefits, including funeral aid from FEMA (up to $35,500).
The results of these studies highlight the need to modernize the death investigation system, including eliminating coroners. Many coroners are also sheriffs, which presents serious conflicts of interests.
If you have information about how Covid-19 deaths are being counted in your community, please contribute to this growing database of evidence, which investigative reporters from @MuckRock and @19Documenting will follow up on.
Beyond our finding that there were more than many unexplained excess deaths in the US between 2020 and 2021, our current study also offers several important insights into how the geography of the pandemic has changed over time.
A prior study by our team, which only covered the year 2020, found substantial heterogeneity in excess death rates across the country. In our current study, we found significant variation in excess death rates in both 2020 and 2021. The excess death rate was highest in the Mideast during 2020 and in the Southeast in 2021.
In the Far West, Great Lakes, Mideast, and New England, there was an urban mortality disadvantage in 2020, which was reversed in 2021. In other parts of the U.S., there was a rural mortality disadvantage in 2020, which was exacerbated in 2021.
When we visualize excess death rates across regions and metro status, it is apparent that Covid-19 is devastating rural America where vaccination rates are low and access to health care is limited.
...Excess deaths were least likely to be assigned to Covid-19 in rural areas and in the Southeast and Southwest, suggesting that many Covid-19 deaths have gone uncounted in these regions.
In follow-up work currently underway, we find that excess mortality is a more sensitive measure than Covid-19 for detecting inequities. This highlights the importance of using excess mortality to understand which communities were most affected during the pandemic.
As Covid-19 surveillance is phased out and more testing occurs at home via rapid tests, Covid-19 death tallies may become even more inaccurate. Excess mortality will continue to be an important tool for monitoring the impact of the pandemic.
More accurate counts may also have immediate implications at the community level by encouraging positive behavioral feedback loops, such as increases in vaccine uptake. This is especially important in rural areas where vaccine rates have lagged.
Our estimates and code are available at the linked GitHub, providing a resource for scientists, reporters, and community partners to examine the determinants of excess mortality and underreporting of Covid-19 deaths across local areas of the US.
I would like to thank my co-authors Eugenio Paglino, @diellelundberg, @Cho___Ahyoung, @JoeWasserman, Rafeya Raquib, @khemp64, @JacobBor, @irmatelo, and Sam Preston. Thank you also to the @RWJF @NIHAging for their generous financial support.
Prof. Stokes has also provided the raw data used to put together this study, which I've in turn entered into my existing 2020 county-level partisan lean spreadsheet.
There's a few caveats to keep in mind here:
- First, the data from this study only includes 3,127 of the 3,144 total U.S. counties, parishes (Louisiana) & county-equivalents (Alaska, Virginia).
- Most of the missing counties are in Alaska, due to their unusual "census area" system & boundary changes over time. The other missing counties are La Paz County, Arizona; Adams, Boulder, Broomfield & Weld Counties, Coloardo; and Park County, Montana. These counties only have a combined population of around 1.34 million people, however, or just 0.4% of the total 50-state +DC U.S. population, so any impact from them should be nominal at most.
- The study itself is a "preprint" which hasn't been peer reviewed certified yet, and as a professionial study, it includes a whole mess of methodology details & caveats/disclaimers.
- The study breaks out excess deaths into two main chunks: March - December 2020 and January - December 2021. I've applied 2020 partisan lean data (specifically, what percent of the vote in each county went to Donald Trump in the November 2020 election) to each independently, then combined the two years to see what it looks like for the first 21 months of the pandemic.
With all of this in mind, here's how the three data sets break out.
First, here's what it looks like from the beginning of the COVID pandemic in the U.S. (starting March 1, 2020) through the end of December 2020:
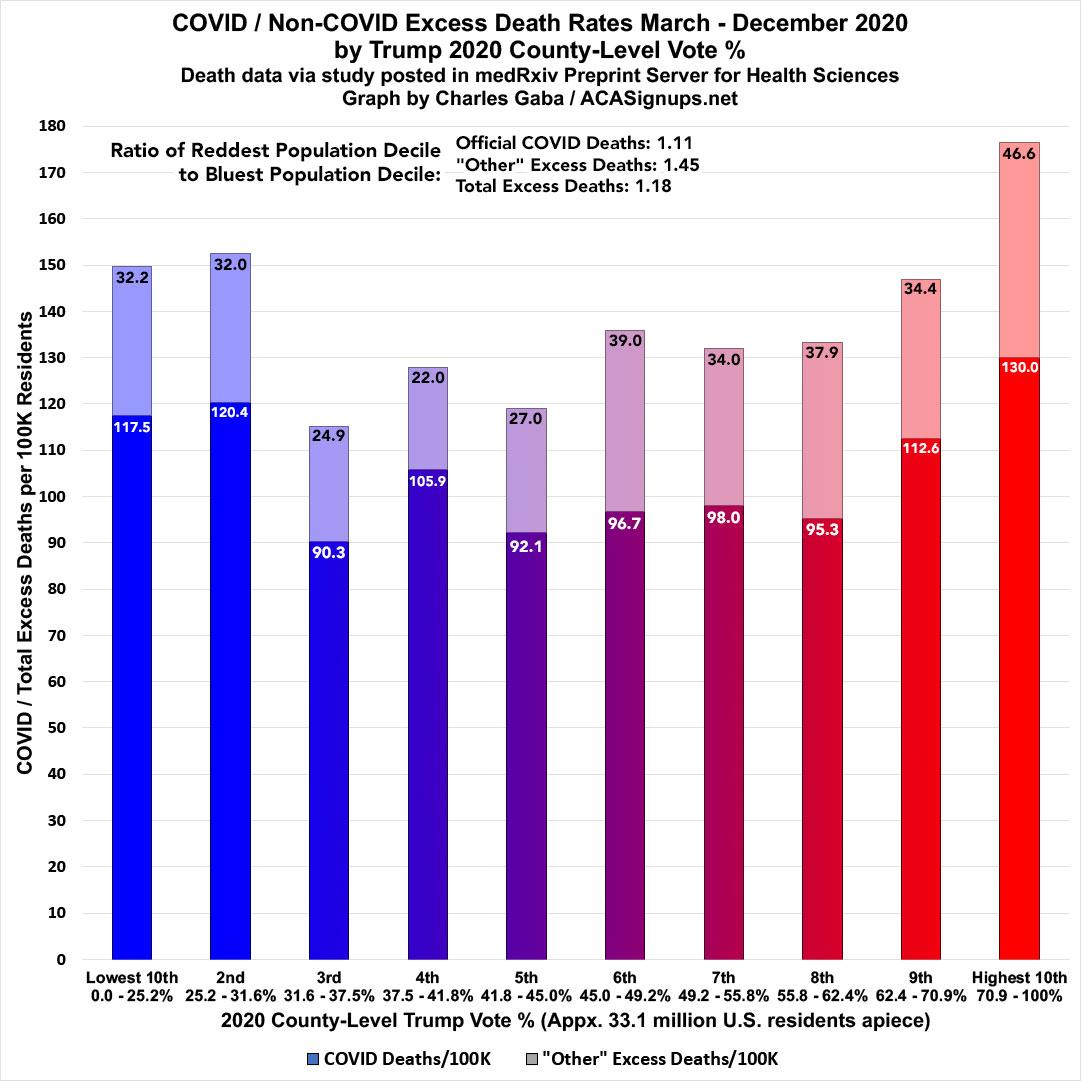
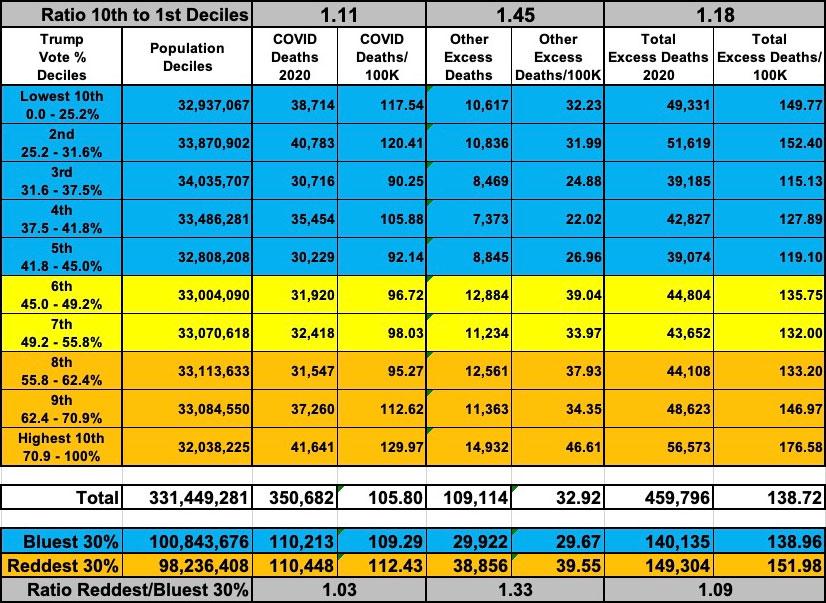
As noted in Stokes' Twitter thread, nearly a quarter of all excess U.S. deaths in 2020 were not officially categorized as COVID-19 (around 23.7%). Beyond that, however, there wasn't that much of a partisan trend visible for the first year of the pandemic--the reddest counties in the country definitely had higher rates of "not-COVID" deaths in 2020, but not extraordinarly so...COVID deaths ran 11% higher in the reddest tenth of the country while "other" excess deaths ran 45% higher. Overall excess deaths were 18% higher.
When you group together the reddest and bluest 30% of the country (around 100 million residents each), the gaps were narrower: Official COVID deaths were only 3% higher and "other" excess deaths were 33% higher for an overall rate 9% higher.
In 2021, however, things changed dramatically:
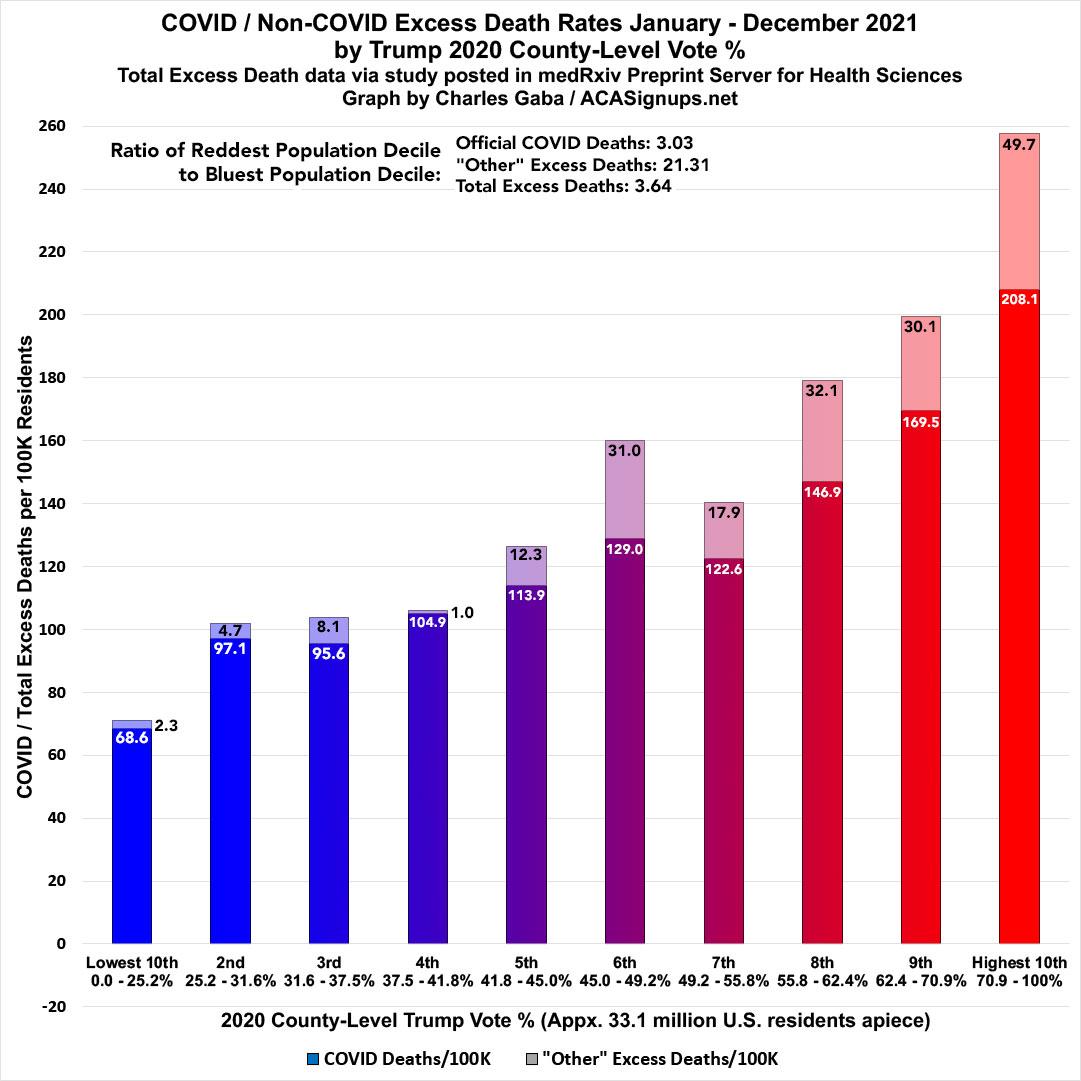
For the full year 2021, official COVID deaths ran more than three times higher in the reddest tenth of the U.S. than the bluest. This is something I've been tracking and writing about for nearly a year now, so while it's pretty dramatic, it's nothing new.
What is new is the "other" excess deaths in 2021: They ran a jaw-dropping twenty-one times higher in the reddest decile than the bluest...nearly 50 per 100K residents vs. only ~2.3 per 100K.
In raw numbers, the least-Trumpy counties (w/just under 33 million residents) reported fewer than 800 "extra" deaths not officially attributed to COVID-19, while the most-Trumpy counties (w/just over 32 million residents) reported nearly 16,000.
Combined with the official COVID deaths, the excess death rate was over 3.6x higher in the reddest decile than the bluest.
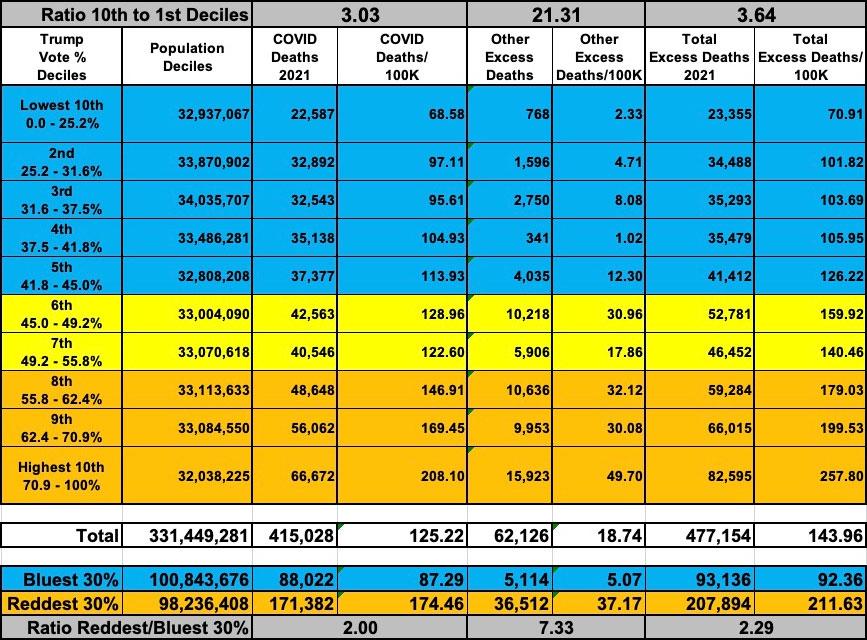
Again, this gap drops significantly if you lump together the bluest and reddest 30% of the country...but it's still a pretty eyebrow-raising difference: Official COVID deaths were still twice as high, while "other" excess deaths were still over 7.3x higher, for an overall ratio of 2.3x higher.
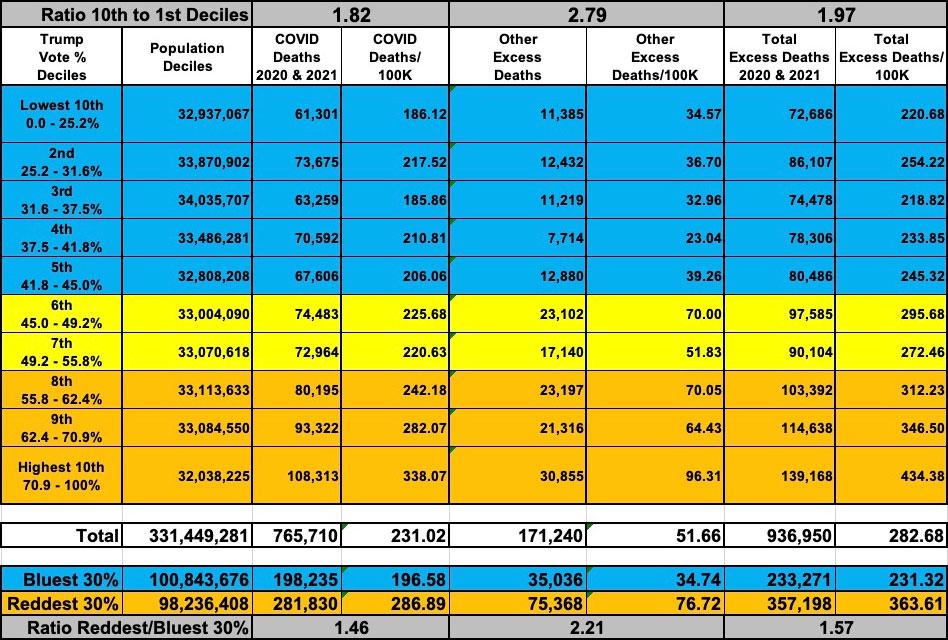
So what does this look like when you combine both years? As you probably figured, it's somewhere in between, although the 2-year ratios hew closer to the 2020 numbers than 2021 since there were 43% fewer total "other" excess deaths in 2021 overall:
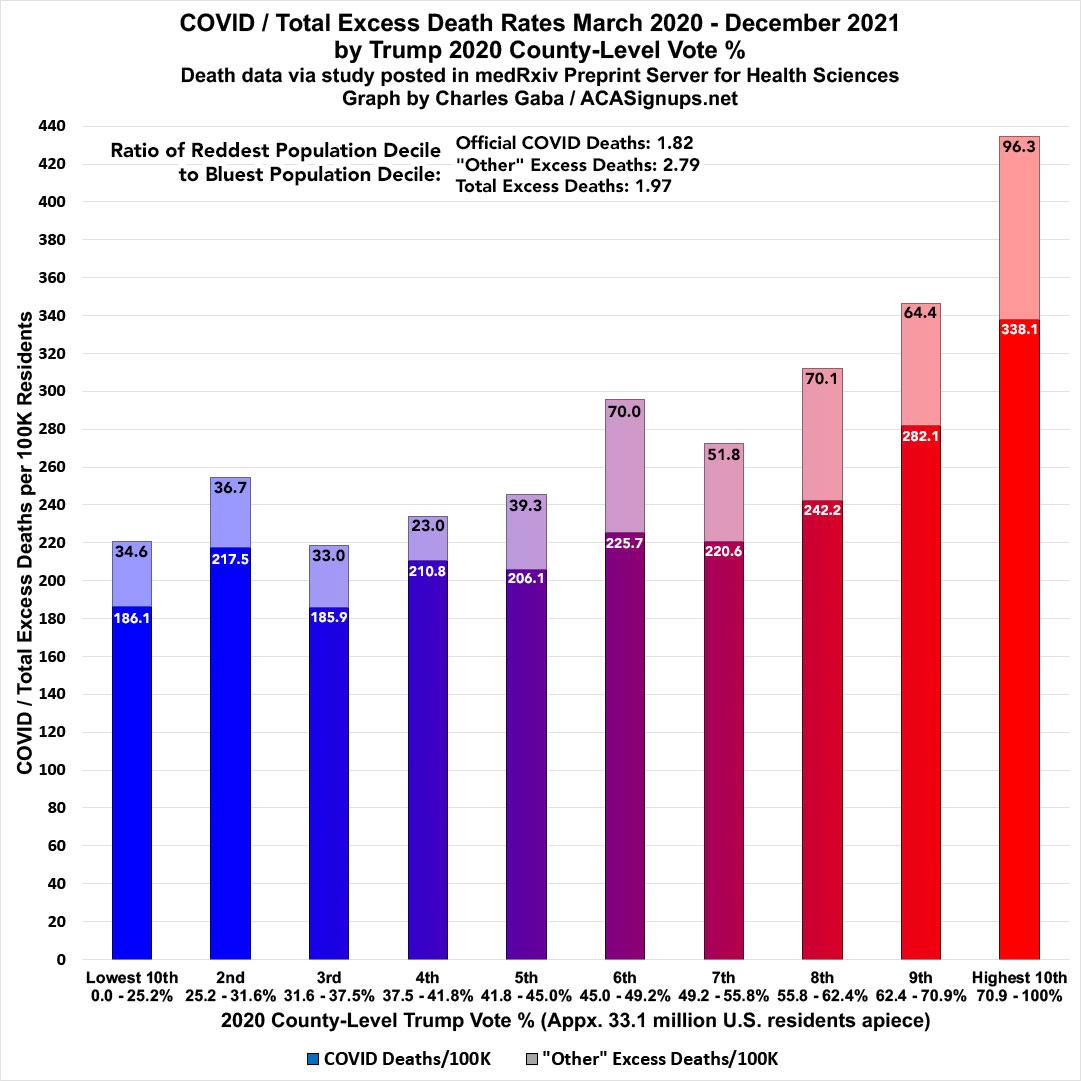
From the beginning of the pandemic through the end of 2021, official COVID deaths ran 1.8x higher in the reddest decile than the bluest, while "other" excess deaths ran 2.8x higher, for a combined rate nearly 2.0x higher overall.
When looking at the reddest & bluest 30% of the nation, the ratios were ~1.5x higher, ~2.2x higher & ~1.6x higher respectively.
One more thing: Here's what the "other' excess deaths look like on a per capita basis at the state level for 2020, 2021 and both years combined. Throughout the pandemic there's been a lot of controversy surrounding Florida's confuisng and ever-changing COVID data reporting methodology, but at least according to the BU study's data, Florida has actually been pretty much in the middle of the pack, ranking 21st in 2020 and 17th in 2021 in "non-COVID" excess death rates.
It's actually Mississippi which ranks highest in all three timeframes...the state reported around 100 "non-COVID" extra deaths per 100,000 residents in each year (5,902 total). Combine this with Mississippi having the highest COVID death rate in the country as well (322/100K through 12/31/21 according to the BU data; over 420/100K as of today according to the most recent data) and the Magnolia State has seen a jaw-dropping 1 out of every 161 residents die over the past two years in addition to the number who normally would have died over that time period. I've highlighted the 5 highest-rate states in each time period below.
This isn't terribly surprising, according to this AP article from last week:
The Mississippi State Medical Examiner’s Office was waiting for about 1,300 reports from as far back as 2011, records sent to AP in early April show. Around 800 of those involve homicides — meaning criminal cases are incomplete.
District attorneys have resigned themselves to long waits: “We’re at a point now where we’re happy if it’s only a year,” said Luke Williamson, who’s been a prosecutor for 14 years in northern Mississippi.
The National Association of Medical Examiners, the office that accredits U.S. death investigations offices, dictates that 90% of autopsy reports should be returned within 60 to 90 days.
Mississippi’s office has never been accredited. The majority of U.S. medical examiner agencies, which are chronically underfunded and face a shortage of forensic pathologists, are unaccredited. States such as Georgia have raised the alarm about autopsy report delays of up to six months. But nowhere is the issue more severe than in Mississippi.
It's also worth noting that there are a surprisingly high number of states where there was actually a negative non-COVID excess death rate in 2020, 2021 or both years combined (highlighted in gray below). This simply means that if you don't include official COVID deaths, there were actually somewhat fewer other types of deaths than you'd normally expect for that state. The two states with the biggest negative numbers are polar opposites in almost every way: Massachusetts and North Dakota.
(click table for higher-resolution version):
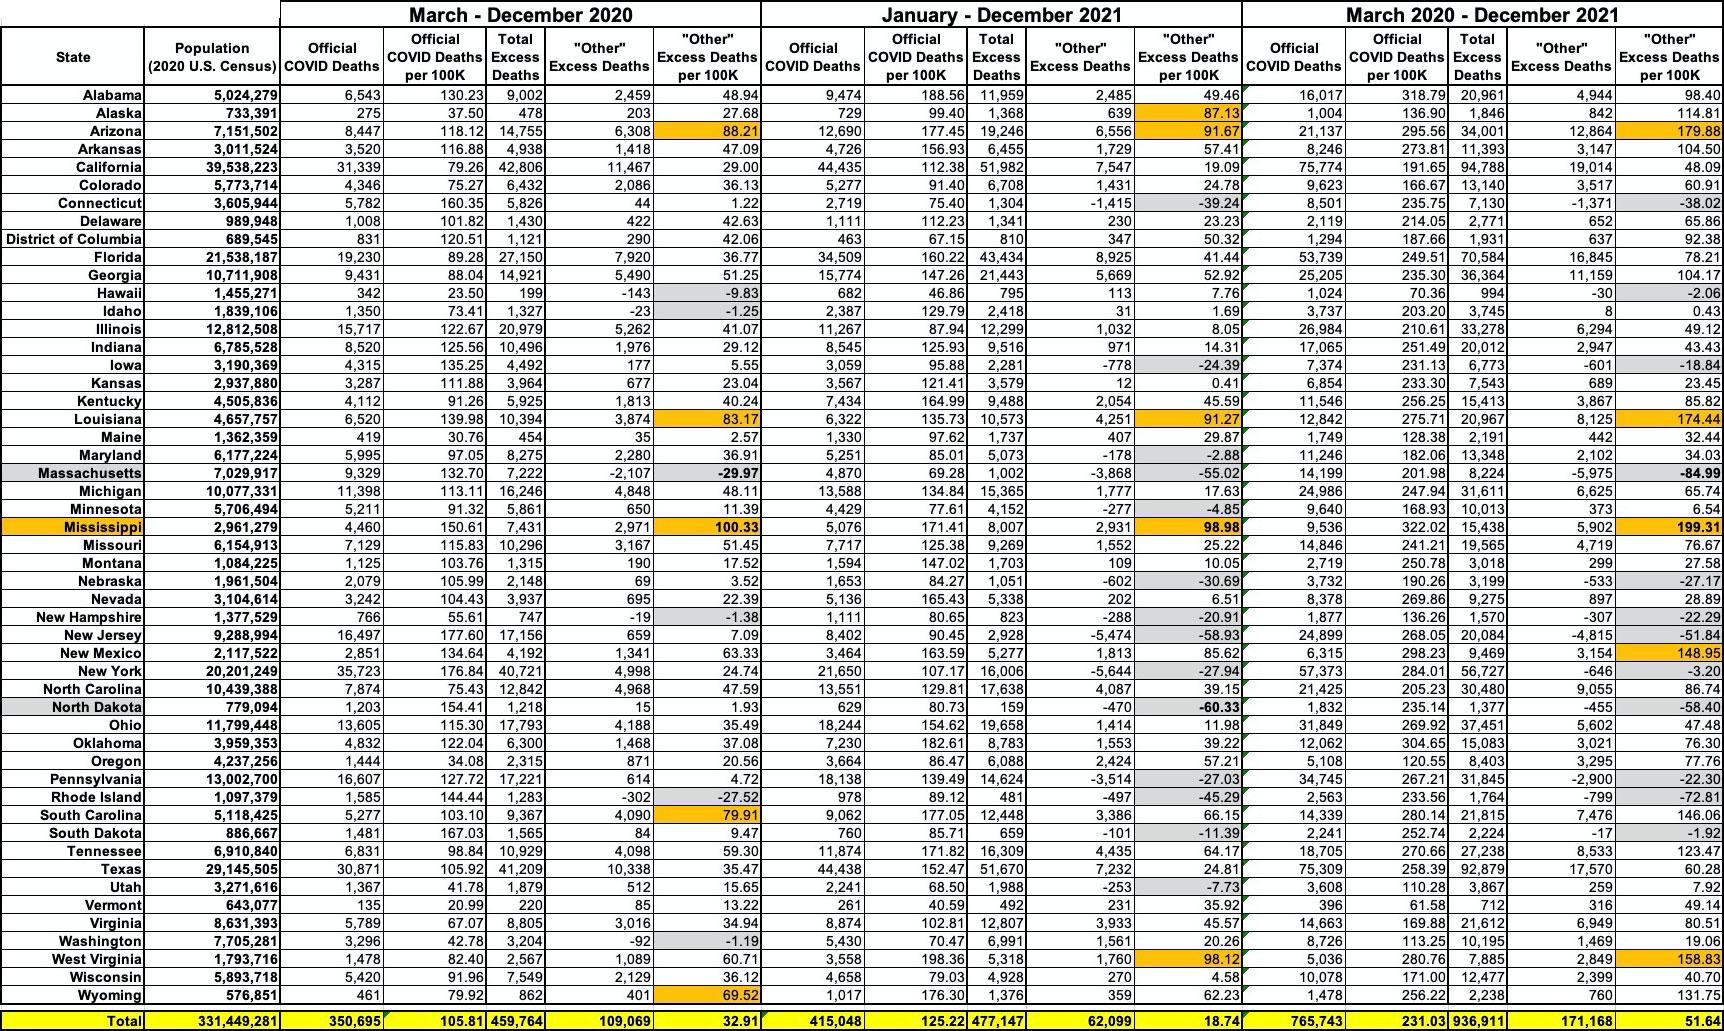
I should also note that the negative "non-COVID" excess death rates in Massachusetts are likely due to a one-time major data error the MA Health Dept. reported a couple of months ago. However, even if you remove Massachusetts from the data entirely (the state has 14 counties, none of which gave more than 43% of the vote to Trump in 2020), the rate in the reddest decile is still 15.3x higher than in the bluest, and the rate in the reddest 30% is still 4.6x higher than in the bluest 30%.
It's worth noting that there seems to be far less of a visible partisan pattern at the state level than the county level. While 8 of the ten highest-rate states for the 2-year period are solid red, it also includes blue New Mexico and purple Arizona. Conversely, 5 of the ten lowest-rate states are solid blue, but the other five are red or purple (Iowa, New Hampshire, Pennsylvania, Nebraska and North Dakota). At the state level it's been a mixed bag; at the county level there was an extremely clear trend.
So, what to make of all this? Well, again, not every "excess" death not categorized as COVID-19 was misdiagnosed, and even some of those which were (especially in the earliest days of the pandemic) weren't necessarily done so knowingly.
However, the data compiled by the BU team strongly suggests that a significant number likely were...and the dramatic partisan breakout of the data throughout 2021 (when "non-COVID" excess deaths dropped to just 5.1 per 100K in the bluest 30% of the country while still running 37.2 per 100K in the reddest 30%) "just happened" to coincide with the massively growing partisan divide throughout the country regarding every other aspect of the pandemic as well, particularly mask mandates and vaccination rates.
Stokes addressed some of this in a Q&A back in February, before he and his team released their latest study which only underscores this point:
Is it your contention that coroners downplay the severity and preponderance of COVID based on their support for Trump, who downplayed the virus?
This study finds an association between the level of support for Donald Trump in a county and the degree of underestimation of COVID-19 deaths. There could be numerous explanations for this finding, which will require additional research to tease out.
One explanation could relate to how deaths are certified in the United States. We find that counties relying on local coroners experienced more underreporting than counties using medical examiners. Unlike medical examiners, coroners are often elected to their position, and may thus be more prone to political bias in determining the cause of death. We also found higher levels of underreporting in areas with the least mask-wearing and least physical distancing, which could indicate a pattern of COVID-19 denial that reduces the probability of COVID-19 testing and valid cause-of-death assignment. Third, underestimation was highest in areas with fewer hospitals and more deaths occurring at home. In these areas, testing infrastructure is more limited, health systems are more easily overwhelmed, and coroners play a larger role in death certification.
...Can we be sure it’s pro-Trump leanings responsible for the undercount? Don’t low-income Democratic-leaning counties have similarly large undercounts, and isn’t the United States behind on testing?
Yes, we found that testing is an important factor in explaining the undercount. Reduced access to testing in areas with Trump support, and reduced use of testing due to COVID-19 denial, could both be mechanisms explaining the higher degree of undercounting in areas with high Trump support.
Advertisement
