The headline is a bit tongue-in-cheek, of course; in spite of Republican "Euro-Socialist" stereotypes, not every country in Europe is "socialist" (and even then, "socialism" has many different flavors/ranges just as "capitalism" does). Still, the irony of this development is rather amusing on the 1-year anniversary of the ACA "Obamacare" health insurance exchanges:
Swiss voters resoundingly rejected a proposal to move the country to asingle-payer system on Sunday. Instead, the country will keep its private health insurance system, which looks a whole lot like Obamacare.
Two-thirds of Swiss voters opposed creating a state-run health plan in the national referendum.
...For a country with a relatively small population (8 million), Switzerland comes up a shocking amount in debates over American health care. That's probably because the Swiss health care system looks pretty similar to the one Obamacare sets up.
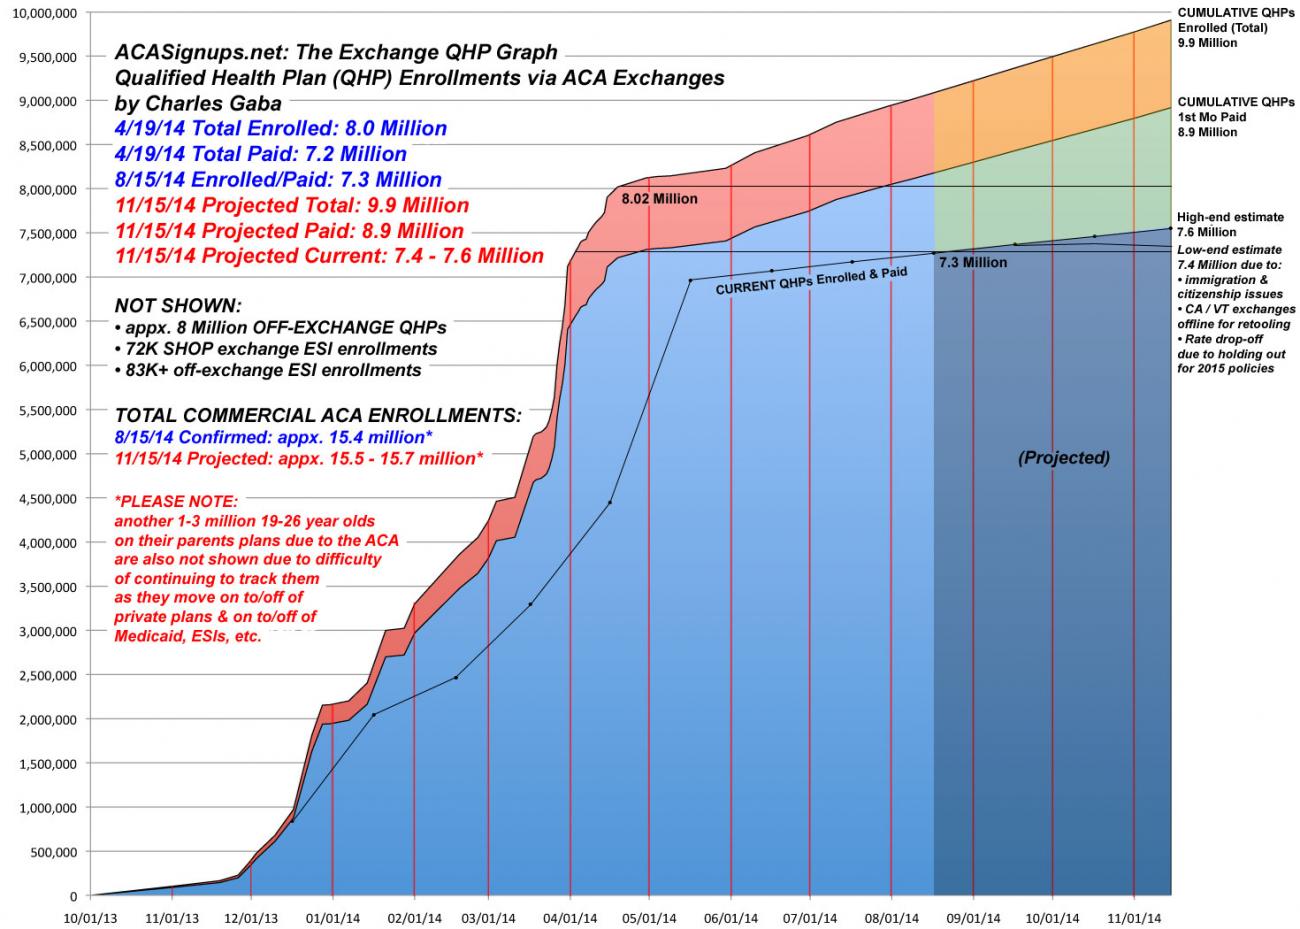
OK, this isn't particularly dramatic given that I've already projected the cumulative total QHP figure to hit around 9.9 million by November 15th, but it's still nice to mark the occasion of another milestone being hit. By my best estimates, assuming 9,000 people enrolling in private Qualified Health Plans via the various ACA exchanges every day during the off-season, the grand total should have hit the 9.5 million mark right around midnight last night.
Of those 9.5 million, I estimate that around 8.2 million of them have paid their first month premium already, with another 300K or so who will do so sometime this month. I further estimate that the current number enrolled (after subtracting those who have dropped their coverage after the first month) should be around 7.4 million at the moment:
At the end of August, Illinois' Medicaid expansion program was up to around 452,000 people (including 93,000 transferred over from the existing CountyCare program). As of the end of September, that total was up another 16,000:
The video also coincides with the release Tuesday of new data by Quinn’s administration that showed 468,000 people enrolled in the expanded Medicaid program since last year, more than double original forecasts.
Of course, the larger point of the article in question is that if Democratic Illinois Gov. Quinn's Republican opponent had been calling the shots, he would have told all 468,000 of his fellow Illinoisians (?) to go pound sand:
SPRINGFIELD — Newly surfaced video of Republican Bruce Rauner obtained by the Chicago Sun-Times shows him telling conservative activists in Lake County last year that, as governor, he would have blocked Gov. Pat Quinn’s 2013 expansion of Medicaid.
Deaconblues provides another article with a similarly curious private enrollment update. I just reported that Ohio's 2014 open enrollment tally was apparently several thousand people higher than originally thought. Now it seems that the same is true in Alaska:
When the ACA open enrollment period ended for 2014, approximately 16,000 Alaskans had purchased individual health insurance plans, with nearly 9,000 receiving federal subsidies through the Federally Facilitated Marketplace.
The official HHS report gave Alaska's number as 12,890 as of 4/19...this is 24% higher than that. The first thing which crossed my mind is that the 16K figure might refer to the current gross enrollment figure, which should indeed be about 18% higher than it was in mid-April nationally. However, the fact that the article itself is an extremely anti-ACA screed by the Alaska Commerce Commissioner makes me pretty confident that she wouldn't try to make the actual enrollment numbers any better than they actually were.
OK, this is a pretty minor update, but according to the last HHS report, as of 4/19, Ohio's official QHP tally stood at 154,668. However, according to this article, it was a few thousand higher than that:
About 157,000 Ohioans signed up for health plans through the federal exchange during the first open enrollment period, which ran from Oct. 1, 2013 into March, 2014. In January, Ohio expanded Medicaid under Obamacare to cover more low-income adults. More than 360,000 people have already enrolled around the state through that new eligibility. And most of the doom and gloom predictions about the Affordable Care Act haven’t come true. Premiums aren’t through the roof, and the website, pretty much works as the federal government prepares for a new round of open enrollment starting Nov.15.
Again, pretty minor stuff, but as we enter the 2nd year of the ACA exchanges being open (slightly different from the 2nd open enrollment period, of course, which doesn't start for another 6 weeks), I figure it's a good idea to get some little details up to date.
Republican U.S. Senator Pat Roberts is scrambling for his political life after the Kansas Democratic Party pulled off a clever maneuver by deliberately dropping out of the race in order to shore up support for independent challenger Greg Orman (who may or may not caucus with the Dems, but would still be a huge step up from Roberts).
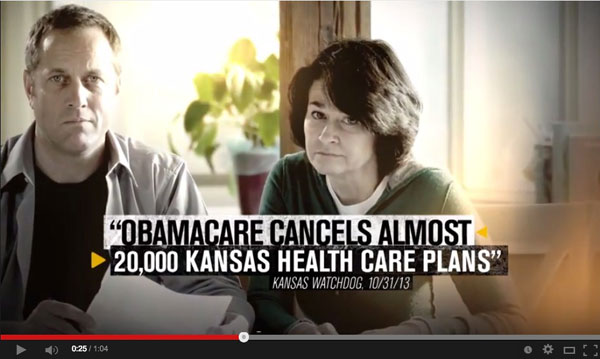
Anyway, Roberts has gone on the attack against Orman with a rather lame attack ad trying to paint Orman as an Obama/Pelosi/Ultra-Leftie Liberal, bla bla bla.
Aside from general Obamacare bashing, the ad makes one interesting claim: That "20,000 Kansans lost their healthcare because of" the ACA. The headline accompanying the narration reads "Obamacare cancels almost 20,000 Kansas health care plans" and cites "Kansas Watchdog" from 10/31/13 as the source:
When I last checked in on New Mexico's Medicaid expansion program, they were at around 55% of the total eligible. As of late August (judging by the Sept. 1st byline on the article), that number was up to 71%:
New Mexico projected that Medicaid expansion would sign up 219,000 new enrollees over a six-year period. In the first year alone (2014), they have already signed up 155,000, 71% of the best-case six-year estimate.
According to this article, WV's uninsured rate in 2013 stood at rougly 255K, of which 150K were eligible for the ACA's Medicaid expansion provision. Apparently they hit 145K as of 2 weeks ago...or 97% of the total eligible.
Now, the way the article words it, it's conceivable that the 145K figure could include some renewals and/or "woodworkers", which would mean that the actual percent of newly eligible WV residents is somewhat lower.
However, according to the Kaiser Family Foundation estimates, as of last fall WV actually had around 267K uninsured, of which only 143K were eligible for Medicaid expansion. Furthermore, as of mid-July, the number of Medicaid enrollees specifically designated as "due to ACA expansion" already stood at 132,556, which means that we're talking about some number between 132K - 145K...out of some other number between 143K - 150K.
In other words, West Virginia has now enrolled a minimum of 88% of those eligible for Medicaid expansion...up to a maximum of 101%!!
GAH!! That's three "solid numbers but vague definitions attached to them" articles in a row this evening:
Braley also used the debate as an opportunity to show that he has worked with Republicans such as Iowa Gov. Terry Branstad. The two worked together to expand Medicaid, giving more than 80,000 people health coverage who didn’t have it before.
OK, that makes it sound like 80K newly added to Medicaid via ACA expansion. However, in an earlier Iowa update, it made it sound like IA has some sort of Arkansas-like "private option" thing going on which had 20,000 enrolled at that time. So...is the 80K referred to above in addition to those 20K, or are they included in it?
(sigh) Again, not sure how to handle this. Anyone familiar with the Iowa Medicaid situation, please feel free to chime in below. Either way, it sounds like I can safely bump Iowa's "strict expansion" tally up from 20K to at least 80K, anyway...
Hmmm....like Hawaii, this enrollment update is a) tiny (small state) and b) confusing, since it means that either not a single additional person has enrolled in Delaware since April 30th (which I highly doubt), or it means that the number of people dropping out has precisely matched the number added since then (which I also highly doubt), or it means that the reporter got their numbers and dates mixed up by mashing up the 4/30 QHP total with the 8/31 Medicaid total:
As of Aug. 31, a total of 22,340 Delawareans have enrolled in coverage since Oct. 1, 2013, which Rita Landgraf, secretary of Delaware Health and Social Services, said came as a pleasant surprise to the commission.
...Of the enrollees in the health-care marketplace over the past 11 months, 7,943 individuals enrolled as part of the Medicaid expansion, an 8 percent increase from the month of July.